Chapter 10:
Multiple Tests of Association with Biological Annotation Metadata
This chapter is
based on
R packages
The following
packages are needed for the analyses performed in Chapter 10 and may be
downloaded from the Bioconductor
Project website (Release 1.7).
Software: annafy
(Version 1.2.0), annotate
(Version 1.8.0),
multtest
(Version 1.8.0).
Experimental data: ALL
(1.0.2).
Annotation metadata: GO
(Version 1.10.0), hgu95av2
(Version 1.10.0).
R code
Section 10.3.
The Gene Ontology [BAM.R]
Supplementary
tables and figures
Supplementary Table
10.1.
Differentially
expressed genes between BCR/ABL and NEG B-cell ALL.
This hyperlinked table provides information on the 20 genes found
to be significantly differentially expressed between BCR/ABL and NEG
B-cell ALL, at nominal FWER level 0.05, according to
the bootstrap-based single-step maxT procedure, with two-sample t-statistics
and B=5,000 bootstrap
samples. The information includes: Affymetrix
probe ID, gene symbol, gene name, gene
function, chromosomal location, links to GenBank, Entrez Gene, NCBI Map
Viewer, UniGene, PubMed, AmiGO, and KEGG, test statistics,
and adjusted p-values.
The table was
generated using the annafy package (Version 1.2.0, Bioconductor
Release
1.7).
[ALL_DE.html]
Figure 10.1.
Parameters for tests of association
with biological
annotation metadata. [PDF]
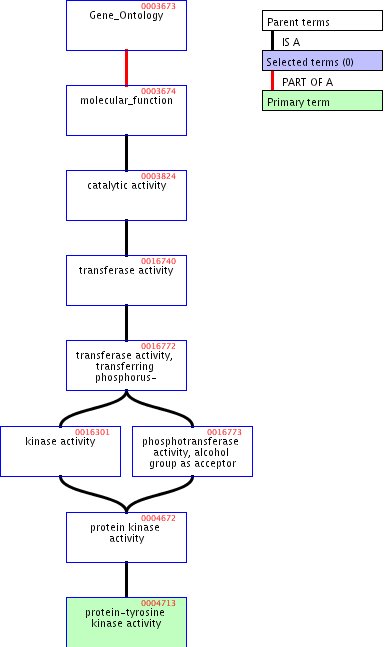
Figure 10.2. DAG for MF GO term GO:0004713, AmiGO.
[JPEG]
Figure 10.3. DAG for MF GO term GO:0004713, QuickGO.
[JPEG]
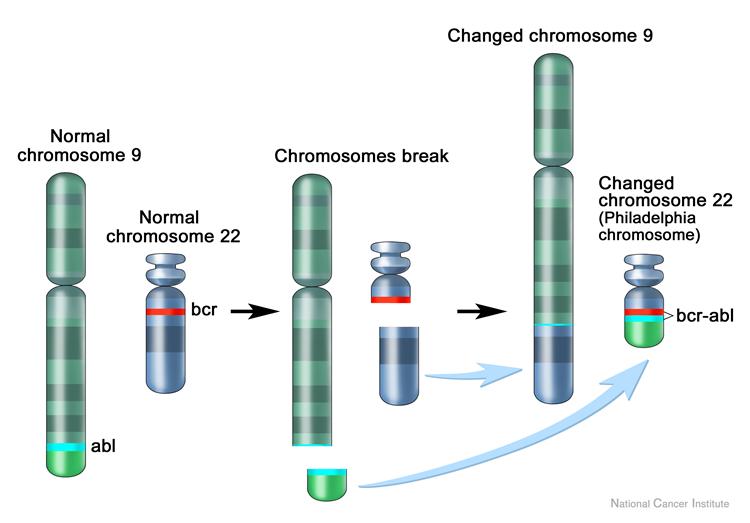
Figure 10.4. The Philadelphia chromosome and the
BCR/ABL fusion.
Panel (a) [JPEG]
Panel (b) [GIF]
Other [JPEG]
Figure 10.5. Differentially expressed genes between
BCR/ABL and NEG
B-cell ALL.
Panel (a) [PDF]
Panel (b) [PDF]
Figure 10.6. GO terms associated with differential gene
expression
between BCR/ABL and NEG B-cell ALL, adjusted $p$-values. [PDF]
Figure 10.7.
GO terms associated with differential
gene
expression between BCR/ABL and NEG B-cell ALL, common terms between
testing scenarios. [PDF]
Figure 10.8. GO terms associated with differential gene
expression
between BCR/ABL and NEG B-cell ALL, conditional distribution of
$\lambda_n^{t}$ given $A$. [PDF]
Figure 10.9. GO terms associated with differential gene
expression
between BCR/ABL and NEG B-cell ALL, comparison of adjusted $p$-values
for the three gene ontologies. [PDF]
Figure 10.10.
GO terms associated with differential
gene expression
between BCR/ABL and NEG B-cell ALL, DAG for top 20 BP GO terms. [JPEG]
Figure 10.11. GO terms associated with differential
gene expression
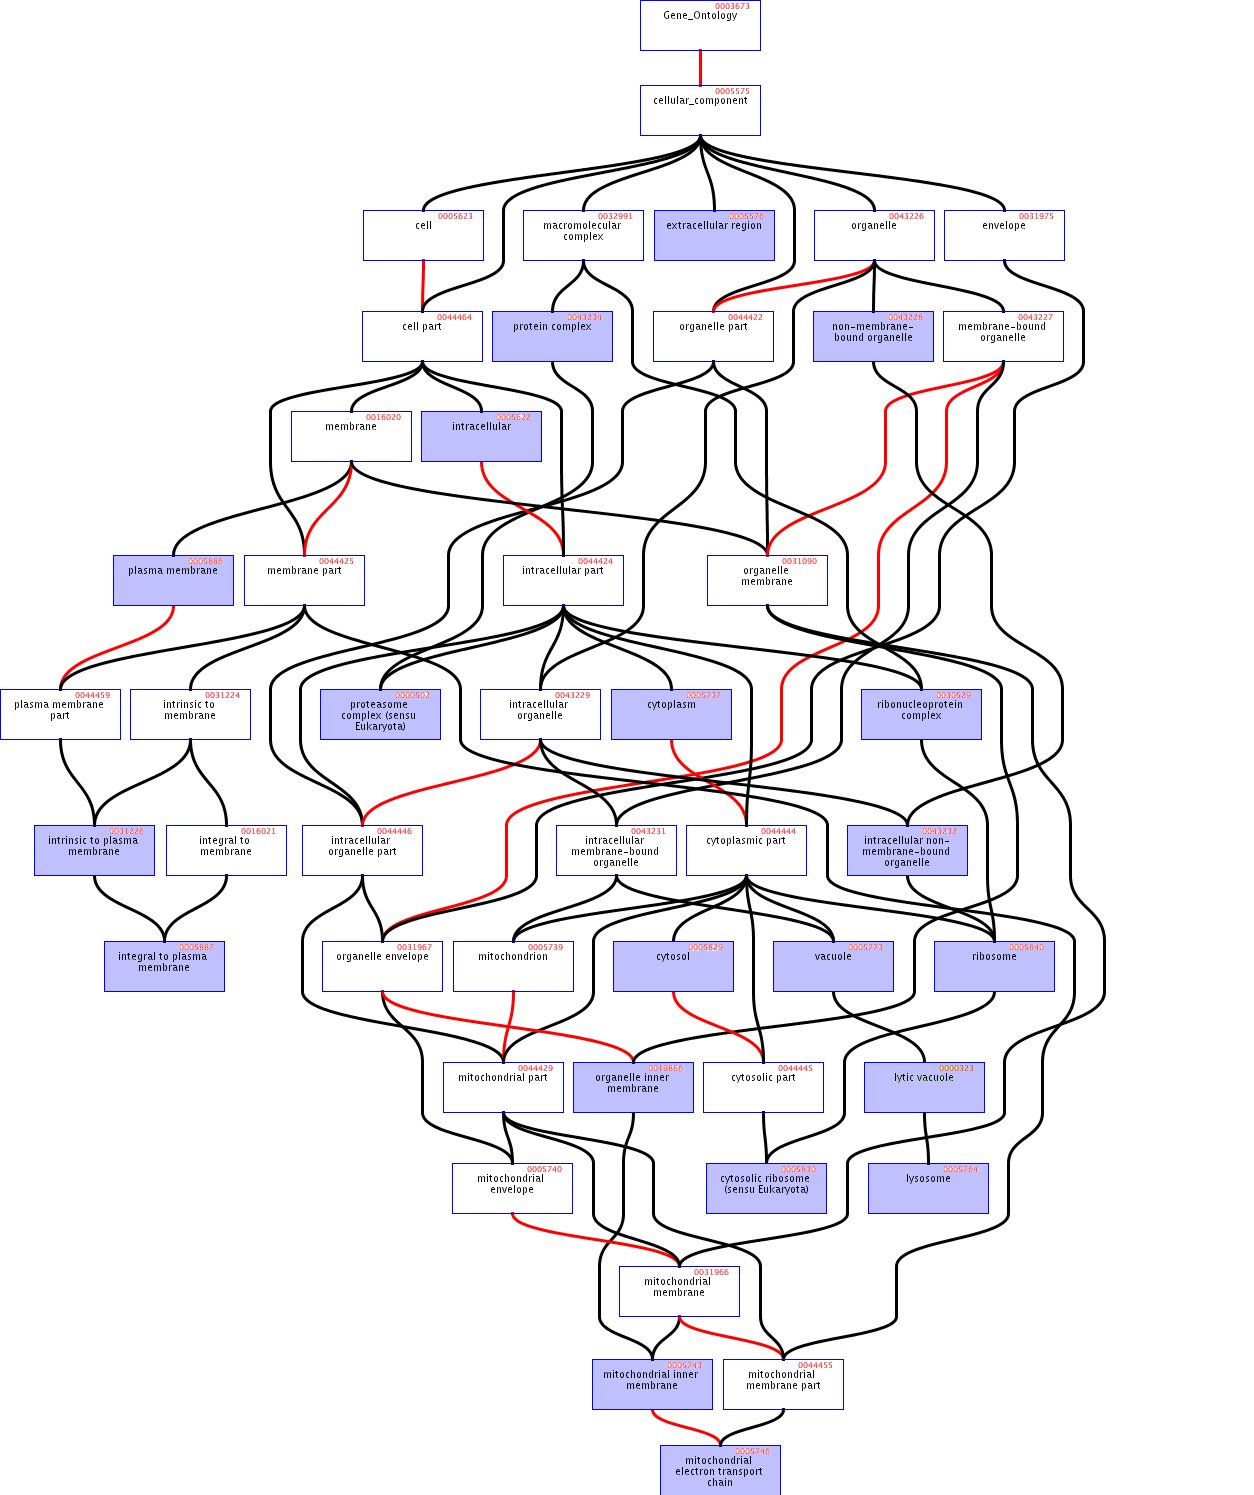
between BCR/ABL and NEG B-cell ALL, DAG for top 20 CC GO terms. [JPEG]
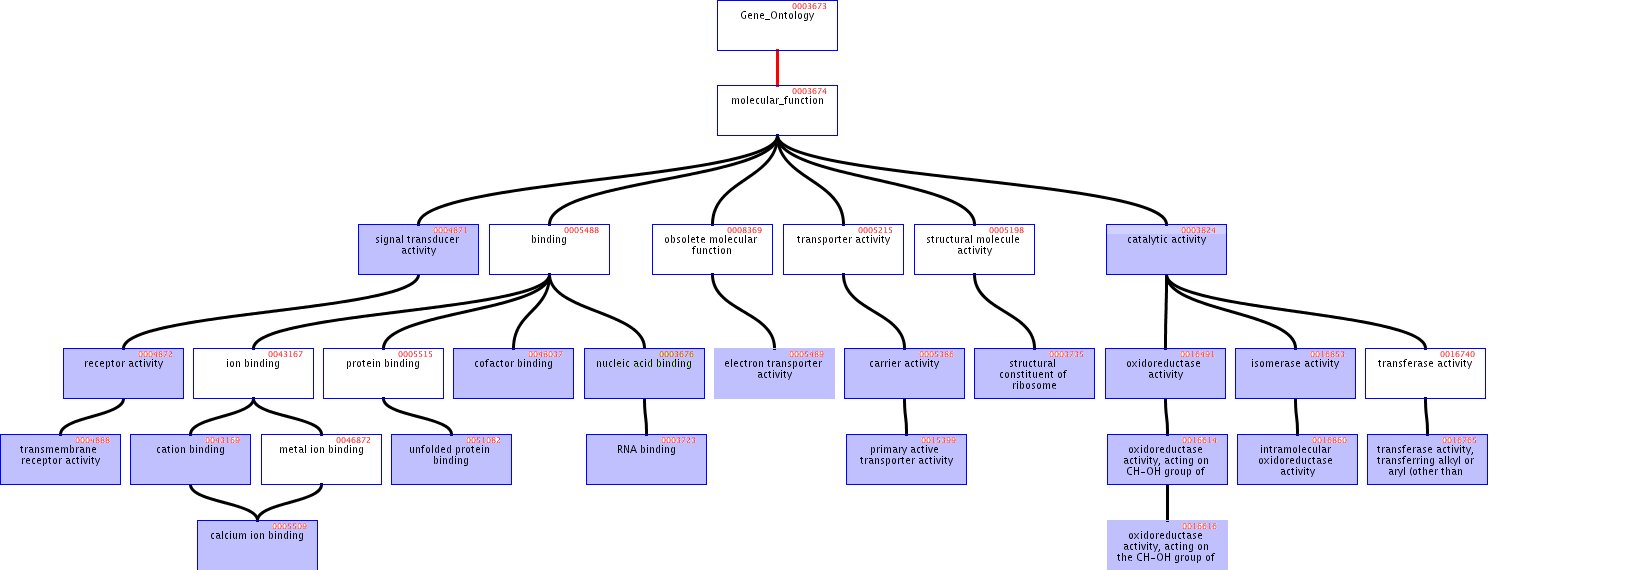
Figure 10.12.
GO terms associated with differential
gene expression
between BCR/ABL and NEG B-cell ALL, DAG for top 20 MF GO terms. [JPEG]
Figure 10.13. GO terms associated with differential gene
expression
between BCR/ABL and NEG B-cell ALL, BP GO term GO:0006916 and MF
GO term GO:0003735.
Panel (a) [PDF]
Panel (b) [PDF]
References
The
Gene Ontology
AmiGO
QuickGO