Chapter 3 Experiments and Observational Studies
“He had fixed his attention on the Broad-street pump as the source and centre of the calamity. He advised the removal of the pump-handle as the grand prescription. The vestry was incredulous, but had the good sense to carry out the advice. The pump-handle was removed, and the plague was stayed.” – Benjamin Richardson, Life of John Snow1
“Hope lies in dreams, in imagination and in the courage of those who dare to make dreams into reality.” - Jonas Salk2
Polio field trials of 1954
John Snow and the London cholera epidemic of 1854
We will cover two examples that illustrate what is an observational study versus an experiment, and we hope that they will pique your interest in statistics and motivate the material we will cover in this course.
The first example is the story of a famous clinical trial - The Salk vaccine field trial. This was a controlled experiment, and we will discuss what that means and why it is important.
The second is a wonderful example of almost establishing causality in an observational study, which is usually very difficult, since we only observe a situation and cannot control the environment. John Snow investigated the outbreak of cholera in London in 1854.
Note that we are not dealing with “big data” in this class. We are going to talk about small data, and try to understand what the data are telling us.
Figure 3.1: xkcd.com/1429/
3.1 The Salk vaccine field trial
“Climax of a Stirring Medical Drama - Dr. Jonas E. Salk’s round-the-clock search for a way to halt polio produces a vaccine now ready for its countrywide test” - headline of a New York Times article from January 10 1954, by Leonard Engels.3
The first epidemic outbreak of polio in the United States was recorded in Vermont in 1894 with 132 cases. Each year this frightening disease struck many children who would go to bed seemingly fine and wake up paralysed. Imagine the utter and helpless fear, if you were a parent. You had no idea how to prevent this disease. Hygiene didn’t seem to help - the incidence was very high in highly sanitized regions. What do you do? Stop your children from swimming? “While it was plain from the outset that the disease was contagious, doctors and charlatans competed with each other to blame outlandish causes, including cats, blueberries, milk, sugar and Italian immigrants. Sales of ice-cream plummeted during the sugar scare; 70,000 cats were massacred during the 1916 panic in New York.”4
In 1938, President Roosevelt established the National Foundation for Infantile Paralysis or NFIP (known today as the March of Dimes) to lead the fight against polio. Scientists were frantically working to isolate the virus that caused this terrifying disease which claimed 57,000 victims in 1952. In 1954, Dr. Jonas Salk and other scientists who had been working on the vaccine felt confident enough to try a field trial - that is, try out the vaccine on volunteers.
The Salk field vaccine trial run by the NFIP was the largest trial of its kind that had ever been held and had to be carefully designed. It was a huge event involving around two million children 5 and it was avidly followed by a desperate nation.
While designing the trial, many questions arose:
Give it to everyone? Why/why not?
How to choose groups? By consent? By grade?
Should the social workers and medical professionals know who receives the vaccine and who receives the placebo?
At first, NFIP proposed vaccinating all 2nd graders, leaving first and third graders as controls. (Used in many schools). Another proposal was to give the vaccine to all children whose parents consented, and compare the incidence rates of polio to the rates among children whose parents withheld consent or consent was not needed. What was the problem with this approach?
The vaccine could not be given to everyone, since there would be no basis for comparison. Polio epidemic and incidence varied from year to year, and it would be impossible to tell if the source of the variation was the vaccine or just a natural dip in the numbers affected. While choosing groups, it turned out that the higher-income (and likely better educated) groups were more likely to consent, but this caused a bias against vaccine since children who grew up in more sanitary surroundings were more vulnerable to the polio virus. Further, the rates across grades could not be compared since polio is a contagious disease. Finally the control group and treatment group had to be from same pool and every child in the pool had to have their parents’ consent.
So why not inoculate all children with consent and leave the others as controls? Well, there are various reasons that this is not good procedure but primarily the researchers would not be able to tell if inoculated only one grade, since polio is contagious, and this would bias the result. Many experts saw the flaws in the NFIP design and proposed a better design.
It was clear that therefore,
A control group (who were given a placebo) and treatment group from same pool of children was needed, to avoid confounding of effect of family background and effect of vaccine.
To avoid bias from human judgement, children were randomly assigned to one of the groups. (randomized controlled experiment)
To avoid the doctors being biased, they were not told which children received the vaccine, and neither did the subjects know (double-blind)
Figure 3.2: xkcd.com/1526/
3.2 John Snow and the London Cholera Epidemic
“In Broadstreet, on Monday evening, when the hearses came round to remove the dead, the coffins were so numerous that they were put on top of the hearses as well as the inside. Such a spectacle has not been witnessed in London since the time of the plague.” - from the London Observer, September 3, 1854
John Snow was a physician during Queen Victoria’s reign and perhaps the first epidemiologist (studying the spread of diseases). He was an independent minded thinker - converting to vegetarianism at the age of seventeen.6 and rejected the prevailing notion of the disease being caused by “miasmas”. At that time, in the mid-nineteenth century, there were essentially two theories about cholera: the miasma theory and the germ theory7. The miasma theory asserted that cholera was somehow transmitted through the “bad air”. People clung to this theory despite evidence to the contrary: cases of people breathing the same air but not all succumbing to the “allegedly poisonous vapors”.8 Snow’s theory that the disease was waterborne was ignored or derided. He correctly believed that cholera was transmitted by a “germ”, but the bacterium that causes cholera,Vibrio cholerae, was not discovered until a couple of decades after Snow’s death.
Snow didn’t believe the miasma theory and set out to examine the evidence. He had a good idea about how the disease might have spread, and hit upon an excellent method of visualization that allowed him to see the link between the different water supplies and the incidence rates of cholera. For an excellent account of his visualization, please see Tufte’s booklet.9
Here is Snow’s original map from the book On the Mode of Communication of Cholera10.
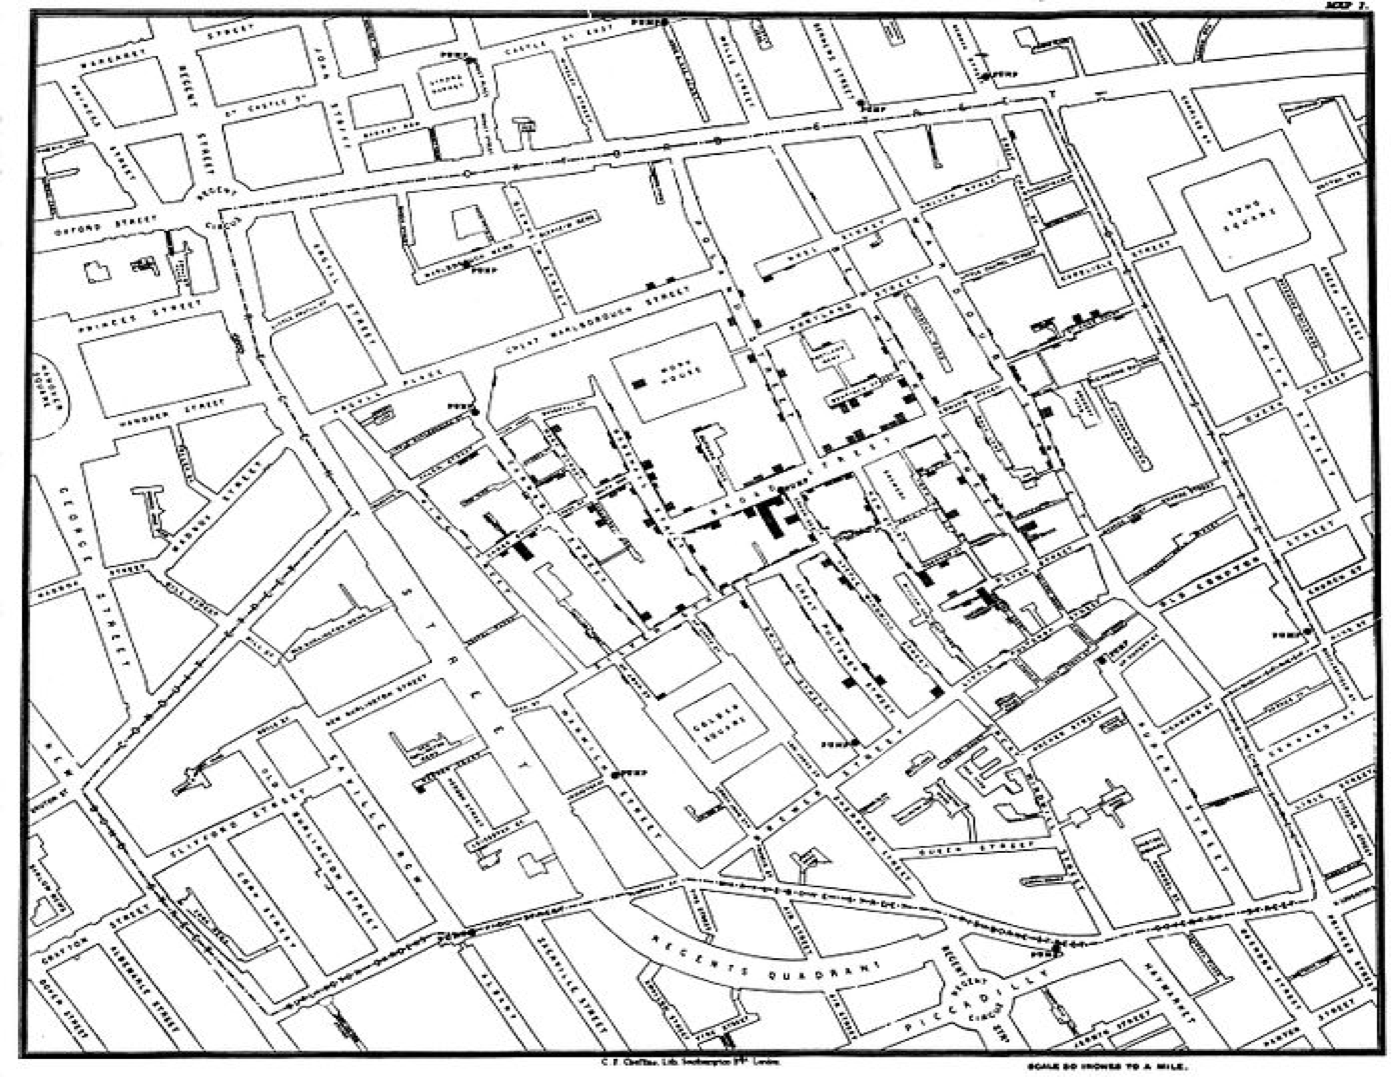
Figure 3.3: Original map made by John Snow (1854)
3.3 Controlled Experiments and Observational Studies
We often want to know the effect of a particular treatment. Some questions we might ask are: - Is a new drug that has been developed for the treatment of colon cancer more effective than the existing protocol? - Does hydroxychloroquine help prevent Covid-19 infections? - Does a new vaccine induce an immune response to SARS-CoV-2 (the virus that causes COVID-19)? - Does a new vaccine developed against polio work?
In all these situations, we need to test effectiveness of a treatment by comparison, so we divide the subjects of the study (cancer patients, children, people exposed to Covid, etc.) into two groups, one of which is given the treatment we are testing, and the other is not. We measure a particular response in each group (cancer cells under a PET scan, incidence of polio, rates of Covid etc.), and compare the levels of the response.
The group that does not receive the treatment is used as a control group, to see what happens if we don’t do anything new, so it serves as a reference mark. It is important that the groups must be the same in all other respects, so that we can attribute any difference to the treatment. The groups are called the treatment group and the control group.
Vocabulary: - Experimental Units: units on which experiments are performed. (Humans are called subjects.)
- Treatment: Specific condition applied to the units.
- Factors: The explanatory variables (vaccine or placebo, say). Specific values of the factors are called levels.
- Placebo: A dummy treatment, such as a sugar pill
- Bias: A design is called biased if it systematically favors certain outcomes.
Note that it is important to clearly distinguish between the explanatory and response variables, since we are trying to reveal the response of one variable to changes in the others.
To recap, in an experiment, we deliberately impose some treatment on a selected group of individuals, and observe their response. They are comparative by design, and the response is compared across different groups. To avoid any confounding or confusing of the effects, we must make sure that the groups only differ in the particular characteristic that we are measuring (on average).
https://timesmachine.nytimes.com/timesmachine/1954/01/10/83315790.pdf↩︎
https://www.theguardian.com/books/2013/jul/17/paralysed-fear-polio-williams-review↩︎
Statistics, by Freedman, Pisani, and Purves↩︎
The Ghost Map by Steven Johnson↩︎
The Ghost Map by Steven Johnson↩︎
Visual and Statistical Thinking: Displays of Evidence for Making Decisions↩︎