Darts is a popular game, played both in the pub and at a professional
level. Yet most players aim for the highest scoring region of the
board (triple 20), regardless of their skill level. It turns out that
this is not always the optimal strategy! We describe a method for a
player to obtain a customized heatmap of the dartboard. In this
heatmap, the bright regions correspond to aiming locations which yield
high (expected) scores. We also investigate alternate arrangements of
the numbers 1 through 20, in an attempt to make scoring more
difficult.
Ever wonder where you should be aiming your dart throws? We've
developed an algorithm so that you can enter the scores of 50 or so
dart throws aimed at the double bullseye, and get a personalized
heatmap in return.
If you are comfortable with the R programming
language:
R package
If you'd rather use a point-and-click tool (and your browser has Java
installed): Java applet
(and if you're curious, the Java source:
DartsApplet.java,
Stats.java)
Movies
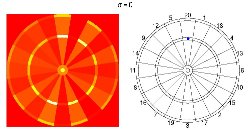
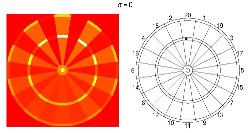
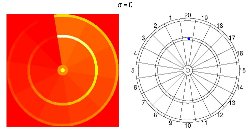
Here are some movies showing the path of optimal aiming locations, for
the various dartboard arrangements discussed in the supplementary
paper. The path is defined by increasing the marginal variance in the
simple Gaussian model. It works best to save them to your computer and
then play them.
Ryan Tibshirani and
Andy Price
were graduate students at Stanford, with Ryan in Statistics
and Andy in Electrical Engineering.
Jon Taylor
is a Professor of Statistics at Stanford and was Ryan's
Ph.D. advisor. Ryan is now in the Statistics department at Carnegie Mellon
and Andy is at Lab126.
We'd like to thank
Rob Tibshirani for his many great suggestions during the development
of the project. We'd also like to thank
Patrick
Chaplin for his eager help concerning the history of the
dartboard's arrangement.