- Consider two events, A and B. Suppose that P(A) = 60% and P(B) = 40%.
i. A and B are mutually exclusive.
ii. A and B cannot be independent.
iii. A cannot imply B.
- A flush in poker is 5 cards of the same suit (all spades, all hearts, all
diamonds, or all clubs), but the five cards cannot be consecutive (e.g., 2, 3, 4,
5, 6 of hearts is a straight flush, not a flush). The chance of being dealt
a flush from a well shuffled deck of 52 cards is closest to
-
We play the following game: I give you a list of numbers; you give me back one number,
not necessarily a number on the list. Call the number you give me x.
I pay you
$100
- (RMS difference between the numbers on the list and x).
To win the most money, you should pick x to be
- In one pocket, I have two quarters; in the other, I have a quarter and a nickel. My
toddler reaches into one of my pockets and grabs a coin. Assume that she picks the pocket
and the coin randomly, and that the chance she reaches into each pocket is 50%, and
the chance that she pulls out each of the two coins in each pocket is the same. What is
the conditional probability that the second coin in the pocket she reaches into is a
quarter, given that the coin she pulls out is a quarter?
- Suppose that in a certain population of used cars, 5% have bad brakes. Consider the null
hypothesis that a car's brakes are fine. Suppose a given mechanic has a 5% chance of
committing a type I error and a 5% chance of committing a type II error in inspecting the
brakes of used cars. Consider selecting a car at random from the population and asking the
mechanic to inspect the brakes. The conditional chance that the car's brakes are bad given
that the mechanic says they are bad is closest to
- Which of the following have distributions that are skewed to the right?
i) salaries of professors at UC Berkeley.
ii) weights of caucasian men age 45-55.
iii) the number of years people take to get a PhD in History
- Suppose that A and B are events. Which of the following is/are always true?
i) the chance A occurs is (100% - chance A does not occur).
ii) the chance A and B both occur is the chance A occurs times the chance B occurs.
iii) the chance either A or B occurs is the chance A occurs plus the chance B occurs.
iv) the chance either A or B occurs is at most the chance A occurs plus the chance B
occurs.
- A box contains tickets labeled with the numbers {-3, -1, 0, 1, 3}. In 100 random draws
with replacement from the box, the expected value of the sum of the positive
numbers on the tickets drawn is closest to
- A box contains tickets labeled with the numbers {-2, -1, 0, 1, 2}. In 100 random draws
with replacement from the box, the SE of the sum of the numbers on the tickets drawn is
closest to
The next few questions refer to a research article by W.J. Spangler, B.S., G.R. Cosgrove,
M.D., H.T. Ballantine Jr., M.D., E.H. Cassem, M.D., S.L. Rauch, M.D., A. Nierenberg, M.D.,
and B.H. Price, M.D., 1996. Magnetic Resonance Image-guided Cingulotomy for Intractable
Psychiatric Disease, Neurosurgery, 38, 1071-1078. This article reports on 34
patients who underwent MRI-guided cingulotomies to treat refractory psychiatric disease at
Massachusetts General Hospital between May, 1991, and February, 1995.
The 34 patients, 18 male, 16 female, ages 16-71, mean age 37, had all been referred by
their treating psychiatrists and reviewed by the MGH Cingulotomy Assessment Committee
(comprised principally of a subset of the authors) to become candidates for the procedure.
The committee had to agree unanimously that the patient should undergo the procedure, and
the patient had to give his or her informed consent. Prerequisites for the committee to
favor treatment included patient's resistance to pharmacotherapy, psychotherapy, behavior
therapy, and electro-convulsive therapy (when applicable), and the symptoms had to be
severe and unremitting for at least one year. All patients had a documented DSM III-R
disease that interfered significantly with normal functioning (e.g., major
affective disorder with unipolar depression (10 patients), or bipolar depression (5
patients), undiagnosible developmental disorders (1 patient), and obsessive-compulsive
disorder with major depression (15 patients)). For some patients whose condition failed to
improve 6 months after surgery, additional cingulotomies were performed.
The
cingulotomy procedure is to insert a pair of electrodes into holes drilled in the skull
just above the hairline, to a pre-determined position in the brain (guided by MRI).
Radio-frequency electricity is passed through the electrodes, to raise the temperature in
the part of the brain between the electrodes to 85�C (185�F) for 90 seconds, essentially
cooking part of the brain between them. (This causes what is called a radio-frequency
thermocoagulation lesion). The basic procedure was changed in 1993 to include a larger
part of the brain.
Of the 34 subjects, 31 were available for follow-up assessment of some sort; of the 31,
two had committed suicide. Follow-up assessment was done two ways: either the referring
psychiatrist or the treating psychiatrist completed two questionnaires---the Clinical
Global Improvement Scale, and the Current, Global, Psychiatric-Social Status Scale---or,
if the patient was no longer seeing a psychiatrist, the most recent correspondence with
the patient was used to assign ratings. I could not find a reference to the number of
patients who were in each of these categories. On the basis of these ratings, each patient
was classified as a "responder" (R), a "possible responder" (P), or a
"non-responder" (N).
Fourteen of the patients who had not responded six months after the initial procedure
underwent multiple procedures. The categorized responses were as follows:
| procedure |
%R |
%P |
%N |
| single cingulotomy, procedure 1 (11) |
33 |
33 |
33 |
| single cingulotomy, procedure 2 (23) |
38 |
0 |
62 |
| multiple procedures (14 of initial N) |
36 |
36 |
28 |
| overall (31 patients, single and multiple) |
38 |
23 |
38 |
The article breaks down the responses further by type of mental illness.
- The cingulotomy research is
- Which of the following might reasonably be expected to bias the results of the
cingulotomy research?
i) the placebo effect
ii) the expectations/hopes of the surgeons and psychiatrists
- In the cingulotomy research, which of the following would be important to know to assess
the effectiveness of an MRI-guided cingulotomy for treating psychiatric disease?
i) The fraction of psychiatric patients in general who recover from severe psychiatric
symptoms that last a year or longer.
ii) The effect of a cingulotomy on people without mental illness.
iii) The number of patients whose follow-up evaluations were based on letters from them,
rather than assessments by a psychiatrist.
- In the cingulotomy research, 38% of the 31 patients were classified as responders. An
approximate 95% confidence interval for the fraction of patients with severe psychiatric
symptoms lasting a year or longer who would respond to single or multiple cingulotomies
cingulotomy is
- i) According to the Law of Large Numbers, in repeated independent trials with the same
probability p of success in each trial, the chance that the fraction of successes
differs from p by more than 0.001 goes to zero as the number of trials increases.
ii) According to the Square-Root Law, the sample mean of n draws with replacement
from a box of numbered tickets will differ from the average of the numbers on the tickets
in the box by (SD of the numbers on the tickets in the box)/n½.
iii) According to the Square-Root Law and the Frequency Theory of Probability, if you
repeat indefinitely the process of taking the sample mean of n random draws with
replacement from a box of numbered tickets, average the square of the difference between
the sample mean and the average of the box, and take the square-root of the result, the
answer will converge to (SD of the numbers on the tickets in the box)/n½
as the number of repetitions grows.
-
A researcher wishes to determine the fraction of individuals with MBA degrees in
executive positions in a certain large corporation. She obtains a complete list of the
names of the executives; there are 1000. She takes a simple random sample of 100 of the
executives to interview; 60 (60%) of them have MBA degrees. She estimates the number of
executives with MBA degrees in the firm as a whole to be 60% of 1000 (600), with a
standard error of
1000×SE(sample percentage) =
1000×(60%×40%)½/100½ = 1000×4.9%
= 49.
On the average, for estimates obtained this way, you would expect
- A certain list of zeros and ones has standard deviation 0.3. The percentage of ones on
the list
-
Preparation H is a treatment for hemorrhoids. A current TV advertisement for Preparation
H reports that more people use Preparation H than use all the other leading brands
combined, and that more people trust Preparation H. The viewer is invited to conclude that
Preparation H is therefore the best hemorrhoid treatment on the market. This inference is
dubious, for a variety of reasons. The most important is that
- I desire to estimate the percentage of properties in Berkeley with more than $3000 in
annual property taxes. I obtain a list of all property addresses in Berkeley, and take a
simple random sample of size 100 from the list, which contains several thousand addresses.
I then contact the Alameda County Tax Assessor's office and obtain copies of the tax bills
for those 100 properties. The sample percentage with tax bills over $3000 is 30%. An
approximate 95% confidence interval for the percentage of properties with tax bills over
$3000 is
- I desire to test the null hypothesis that the 90th percentile of some population is 3,
against the alternative hypothesis that it is greater than 3. I will base my test on the
number of values that are bigger than 3 in a random sample of size 5 with replacement from
the population. Assume that if the 90th percentile really is 3, the number of values
bigger than 3 is like the number of tickets labeled "1" one gets in five random
draws with replacement from a box that contains 9 tickets labeled "0" and one
ticket labeled "1." If the null hypothesis be true, the number of values greater
than three has a
- (Refers to problem of 90th percentile) If the null hypothesis be true, the expected
number of sample values greater than three is
- (Refers to problem of 90th percentile) To have a test with significance level 1%, I
should reject the null hypothesis when the number of sample values greater than 3 is
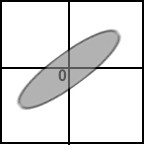
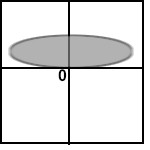
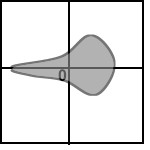
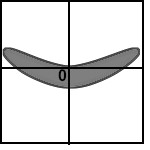
Below are sketches of residual plots from four regressions. Characterize each plot
according to whether
(a) something is wrong with the way the regression line was computed
(b) residuals are heteroscedastic
(c) relationship is nonlinear
(d) residuals are heteroscedastic and relationship is nonlinear
(e) everything is fine
- The points on a scatterplot of two variables lie exactly on a straight line with slope
-0.4. The point of averages is (1,-0.4).
The correlation between the two variables is
- In the previous question, the equation of the regression line for regressing Y on X is:
-
At a certain university, the average class size is 25 students. Consider the
percentage of classes at that university with more than 100 students.
The smallest value that that percentage cannot exceed is closest to
-
I wish to study the effect of daily consumption of small amounts of alcohol (say, two
glasses of wine) on the incidence of heart disease.
In several European countries, it is
customary to drink wine with dinner, while in most Islamic countries, it is not. I
therefore decide to compare the average incidence of heart disease for several European
countries in which the average daily consumption of wine is two glasses, with the
incidence of heart disease in Saudi Arabia, where the consumption of alcohol is negligable
(it is a capital offense).
It turns out that the incidence of heart disease is lower in Saudi Arabia.
i) Because individual drinking patterns vary, the assignment of subjects to treatment and
control is effectively random.
ii) Because the sample sizes are very large, we should be able to detect a small effect if
it exists (the test will have good "power" to detect that the null hypothesis is
false if it is false).
iii) This is an observational study.