SticiGui© Sample Midterm 1


  1. Consider two events, A and B. Suppose that P(A) = 90% and P(B) = 60%.
    i. A and B cannot be mutually exclusive.
    ii. A and B cannot be independent.
    a) i is true, ii is false.
    b) i is false, ii is true.
    c) both i and ii are true.
    d) both i and ii are false.
    e) There is not enough information to answer this question.


  2. E. Taub, M. Munz, and R.R. Tasker, ("Chronic electrical stimulation of the gasserian ganglion for the relief of pain in a series of 34 patients," J. Neurosurg. 86, 197-202, 1997) report on the effectiveness of surgically implanted electrodes for reducing facial pain. 34 patients with "chronic medically intractable facial pain" underwent the procedure; 19 of the cases (56%) were deemed successful, in the sense that "there was a reduction of pain by at least 50% whenever the stimulator was on." Those 19 received permanent implants; 7 of them subsequently developed infections. Let's ignore the issue of assessing subjective pain relief, and concentrate on the design.
    a) This is an observational study.
    b) This is an experiment.
    c) This is a controlled experiment.
    d) This is a randomized, controlled experiment.
    e) None of the above.


  3. With reference to the question about treating facial pain with electrical stimulation:
    i) The placebo effect is not likely to be a confounding factor in this design.
    ii) The fact that the surgeons knew who had received treatment is likely to be a confounding factor in this design.
    a) i is true, ii is false.
    b) i is false, ii is true.
    c) Both i and ii are true.
    d) Both i and ii are false.


  4. Garrison Keillor, the host of the radio show "A Prairie Home Companion," tells stories about his hometown, Lake Wobegon, MN, "where all the women are strong, all the men are good looking, and all the children are above average." This must be a fictitious place because:
    a) Norwegian bachelor farmers aren't that good looking.
    b) Only half the children in any town can be above average.
    c) People from Minnesota aren't any stronger, better-looking, or smarter than the rest of us.
    d) In any reasonably large sample of people, such as a town, there's bound to be a weak woman, an unattractive man, or an unintelligent child.
    e) None of the above.


  5. A "full house" in poker is three of one kind and a pair of another kind; for example, the Ace of Spades, Ace of Hearts, Ace of Clubs, 2 of Diamonds and 2 of Clubs. Assuming that five cards are dealt from a well-shuffled, standard 52 card deck, the chance that the five cards are a "full house" is
    a) 13C2 × 4C2 × 4C3/52C5.
    b) 13 × 12 × 4C2 × 4C3/52C5.
    c) 13C2 × 45/52C5.
    d) 13C1 × 12C1 × 45 × /52C5.
    e) 52C2 × 45/52C5.


  6. The area under the normal curve between +1 and +2 is closest to
    (a) 6%. (b) 14%. (c) 28%. (d) 32%. (e) 48%.


  7. Suppose that in a certain group of married couples, the average IQ of men and of women is 100 points, the SD of IQ of men and of women is 15 points, and the correlation coefficient between the IQ's of wives and husbands is 0.8. The scatterplot of IQ's is football-shaped. The regression line prediction of the average IQ of men married to women whose IQ is 120 points is closest to
    a) 125 points.
    b) 120 points.
    c) 115 points.
    d) 110 points.
    e) cannot be determined from the information given.


  8. This refers to the question about the IQs of married couples. The rms error of regression is closest to
    a) 15 points.
    b) 12 points.
    c) 9 points.
    d) 6 points.
    e) cannot be determined from the information given.


  9. This refers to the question about the IQs of married couples. The 84th percentile of the IQ of men married to women whose IQ is 120 is closest to
    a) 130 points.
    b) 125 points.
    c) 120 points.
    d) 115 points.
    e) cannot be determined from the information given.


  10. This refers to the question about the IQs of married couples.
    i) Because of regression towards the mean, the woman with the highest IQ will be married to a man whose IQ is lower than hers.
    ii) In spite of regression towards the mean, the woman with the highest IQ is likely to be married to a man whose IQ is even higher than hers, because smart men don't like to marry women who are smarter than they are.
    iii) Because of regression towards the mean, a child of the woman with the highest IQ (assuming she has children) is likely to have an IQ that is above average, but not as high as hers.
    a) i is true; ii and iii are false.
    b) i and iii are true; ii is false.
    c) ii is true; i and iii are false.
    d) ii and iii are true; i is false.
    e) iii is true; i and ii are false.


  11. In the following sketch of a scatterplot, the slanting line is image for midterm question
    a) The graph of averages.
    b) The SD line.
    c) The regression line of Y on X.
    d) The regression line of X on Y.
    e) None of the above.

  12. Y. Zhang et al., in "Bone mass and the risk of breast cancer among postmenopausal women," New England J. Medicine, 336, 611-617, 1997, report on the incidence of breast cancer among 1373 women who had had hand X-rays between 1967 and 1970, had not had breast cancer at that time, and were age 47-80 at that time. The area of one of the bones in their wrists was measured from the X-ray images. The women were followed until 1993. By that time, 91 of the subjects had developed breast cancer. In analyzing the data, the scientists divided the women into two-year age groups to control for the effect of age on bone area (people tend to lose bone mass after maturity). They also tried to control for education, height, body mass, age at first pregnancy, parity (number of children), age at menopause, alcohol consumption, cigarette smoking, level of physical activity, and use of postmenopausal estrogen, on the incidence of breast cancer, with which all of these factors have been associated. (They do this "controlling" using a multivariate regression model, which we shall not question here.) After adjusting for these other factors, there was an association between bone area and the incidence of breast cancer: the incidence of breast cancer among women in the top quartile of bone area (adjusted for age) was about 3.5 times higher than the incidence among women in the bottom quartile. There is a known positive association between long-term postmenopausal estrogen exposure and retention of bone mass, and there is a known positive association between estrogen level at a given time and breast cancer.
    a) Because this is a longitudinal study, the effects of confounding should be reduced.
    b) Because this is a cross-sectional study, age is likely to be confounded with other factors.
    c) This study provides evidence that long-term estrogen exposure increases the risk of breast cancer.
    d) (a) and (c) are true.
    e) None of the above is true.

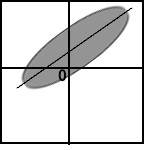
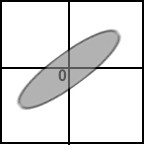
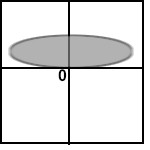
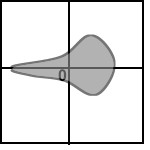
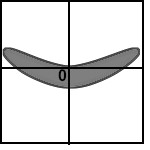
    Below are sketches of residual plots from four regressions. Characterize each plot by one of the following letters, according to whether the plot reveals
    (a) something's wrong with the regression
    (b) residuals are heteroscedastic
    (c) relationship is nonlinear
    (d) heteroscedastic and nonlinear
    (e) everything's fine


  13. image for midterm question

  14. image for midterm question

  15. image for midterm question

  16. image for midterm question


  17. The points on a scatterplot of two variables lie exactly on a straight line with slope -2. The point of averages is (-1,1). The correlation between the two variables is
    (a) -2, (b) -1, (c) 1/2, (d) 1, (e) not enough information.


  18. In the previous question, the equation of the regression line for regressing Y on X is:
    (a) y=2x, (b) y = -2x - 1, (c) y = -x/2, (d) y = -2x, (e) not enough information.


    The next six questions refer to the list {0, 1, 3, 0, -3, -1}.


  19. The mean is: (a) 1/6, (b) 1/3, (c) 1, (d) 0, (e) none of the above.


  20. The median is: (a) -1, (b) 0, (c) 1, (d) 2, (e) none of the above.


  21. The RMS is: (a) sqrt(5), (b) sqrt(3 1/3), (c) sqrt(20), (d) 2, (e) none of the above.


  22. The SD is: (a) sqrt(22/6), (b) sqrt(5), (c) sqrt(3 1/3), (d) sqrt(20) (e) none of the above.


  23. The 25th percentile is: (a) -3, (b) -1, (c) 0, (d) 1, (e) none of the above.


  24. The inter-quartile range is: (a) -1 to 1, (b) 2, (c) -1 to 3, (d) 4, (e) none of the above.


  25. In 100 trips on the Evans Hall elevator, my average waiting time was 3 minutes. The number of times I had to wait more than 15 minutes was no more than (a) 3, (b) 5, (c) 15, (d) 20, (e) cannot be determined from this information.