class: blueBack ## Teaching Evaluations (Mostly) Do Not Measure Teaching Effectiveness ### Teaching Dialogues<br />University of California, Berkeley <br />Berkeley, CA<br />20 March 2017 #### Philip B. Stark<br /> Department of Statistics <br /> University of California, Berkeley<br />http://www.stat.berkeley.edu/~stark | [@philipbstark](https://twitter.com/philipbstark) #### Joint work with Anne Boring, Richard Freishtat, Kellie Ottoboni --- <br /> <br /> .center.large.blue.vcenter[***The truth will set you free, but first it will piss you off.***] .align-right.medium[—Gloria Steinem] --- ### Student Evaluations of Teaching (SET) + most common method to evaluate teaching + used for hiring, firing, tenure, promotion + simple, cheap, fast to administer --- .center.vcenter.large[Part I: Basic Statistics] --- ### Nonresponse -- + SET surveys are an incomplete census, not a random sample. -- + Suppose 70% of students respond, with an average of 4 on a 7-point scale. -- .red[Then the class average could be anywhere between 3.1 & 4.9] -- + "Margin of error" meaningless: not a random sample -- .center[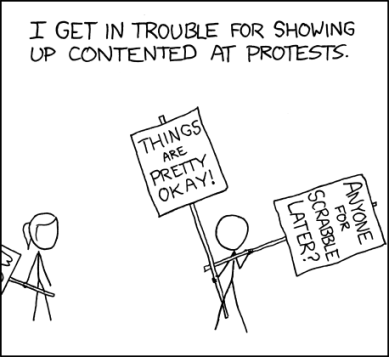] https://xkcd.com/470/ --- ### All our arithmetic is below average + Does a 3 mean the same thing to every student—even approximately? -- + Is a 5 in an upper-division architecture studio the same as a 5 in a required freshman Econ course with 500 students? -- + Is the difference between 1 & 2 the same as the difference between 5 & 6? -- + Does a 1 balance a 7 to make two 4s? -- + Averages throw away important information about variability: - (1+1+7+7)/4 = (2+3+5+6)/4 = (1+5+5+5)/4 = (4+4+4+4)/4 = 4 - Polarizing teacher ≠ teacher w/ mediocre ratings - 3 statisticians go deer hunting … --- ### What does the mean mean? .blue[Averages makes sense for interval scales, not ordinal scales like SET.] -- .red[Averaging SET doesn't make sense.] -- Doesn't make sense to compare average SET across: + courses + instructors + levels + types of classes + modes of instruction + disciplines -- Shouldn't ignore variability or nonresponse. -- .blue[But reporting averages is seductive: <em>quantifauxcation</em>.] --- .center.vcenter.large[Part II: Science, Sciencism] --- 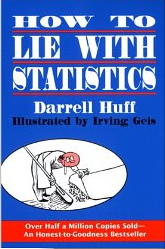 > If you can't prove what you want to prove, demonstrate something else and pretend they are the same thing. In the daze that follows the collision of statistics with the human mind, hardly anyone will notice the difference. .align-right[Darrell Huff] --- ## What's effective teaching? -- + Should facilitate learning -- + Grades usually not a good proxy for learning -- + Students generally can't judge how much they learned -- + Serious problems with confounding -- 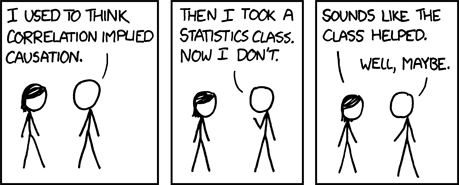 https://xkcd.com/552/ --- ### Lauer, 2012. Comments have issues, too Survey of 185 students, 45 faculty at Rollins College, Winter Park, Florida > .blue[I once believed that narrative comments on course evaluation forms were straightforward and useful.] -- Faculty & students use the same vocabulary quite differently, ascribing quite different meanings to words such as "fair," "professional," "organized," "challenging," & "respectful." -- <table> <tr><th> <em>not fair</em> means …</th><th>student %</th><th>instructor %</th></tr> <tr><td>plays favorites</td> <td>45.8</td> <td>31.7</td></tr> <tr><td>grading problematic</td> <td>2.3 </td> <td>49.2</td></tr> <tr><td>work is too hard</td> <td>12.7</td> <td>0</td></tr> <tr><td>won't "work with you" on problems</td> <td>12.3</td> <td>0</td></tr> <tr><td>other</td> <td>6.9</td> <td>19</td></tr> </table> --- .large.blue.center.vcenter[Do SET measure teaching effectiveness?] ### Dr. Fox lecture <iframe width="420" height="315" src="https://www.youtube.com/embed/RcxW6nrWwtc" frameborder="0" allowfullscreen></iframe> --- ## Reliability - Do different students rate the same instructor similarly? - Would a student rate the same instructor consistently later? -- Unrelated to effectiveness. -- 100 scales might all report your weight to be exactly the same. -- .blue[Doesn't mean they measured your _height_ accurately.] -- .blue[(Or your weight.)] -- ## Validity Do SET primarily measure teaching effectiveness? -- Bias from gender, attractiveness, ethnicity, accent, math content, rigor, time of day, class size? --- ### .blue[All Your Biases Are Belong to Us …] -- #### Unconscious biases against women (and URM) reflected in: -- + grant applications (e.g., [Kaatz et al., 2014](http://www.ncbi.nlm.nih.gov/pmc/articles/PMC4552397/)) -- + letters of recommendation (e.g., [Schmader et al., 2007](http://www.ncbi.nlm.nih.gov/pmc/articles/PMC2572075/), [Madera et al., 2009](http://www.academic.umn.edu/wfc/rec%20letter%20study%202009.pdf)) -- + job applications (e.g., [Moss-Racusin et al., 2012](http://www.pnas.org/content/109/41/16474.abstract), [Reuben et al., 2014](http://www.pnas.org/content/111/12/4403.abstract0)) -- + credit for joint work (e.g., [Sarsons, 2015](http://scholar.harvard.edu/files/sarsons/files/gender_groupwork.pdf?m=1449178759)) -- + .blue[teaching evaluations] --- ### Retorts: -- + But I know some women who get great scores…they even won teaching awards! -- + I know SET aren't perfect, but surely they have _some_ connection to effectiveness. -- + I get better SET when I feel the class went better. -- + Shouldn't students have a voice in evaluating teaching? --- #### Rutgers law dean asks students not to comment on women faculty dress ([IHE](https://www.insidehighered.com/news/2015/01/29/rutgers-camden-law-dean-asks-students-stop-talking-about-women-professors-attire)) 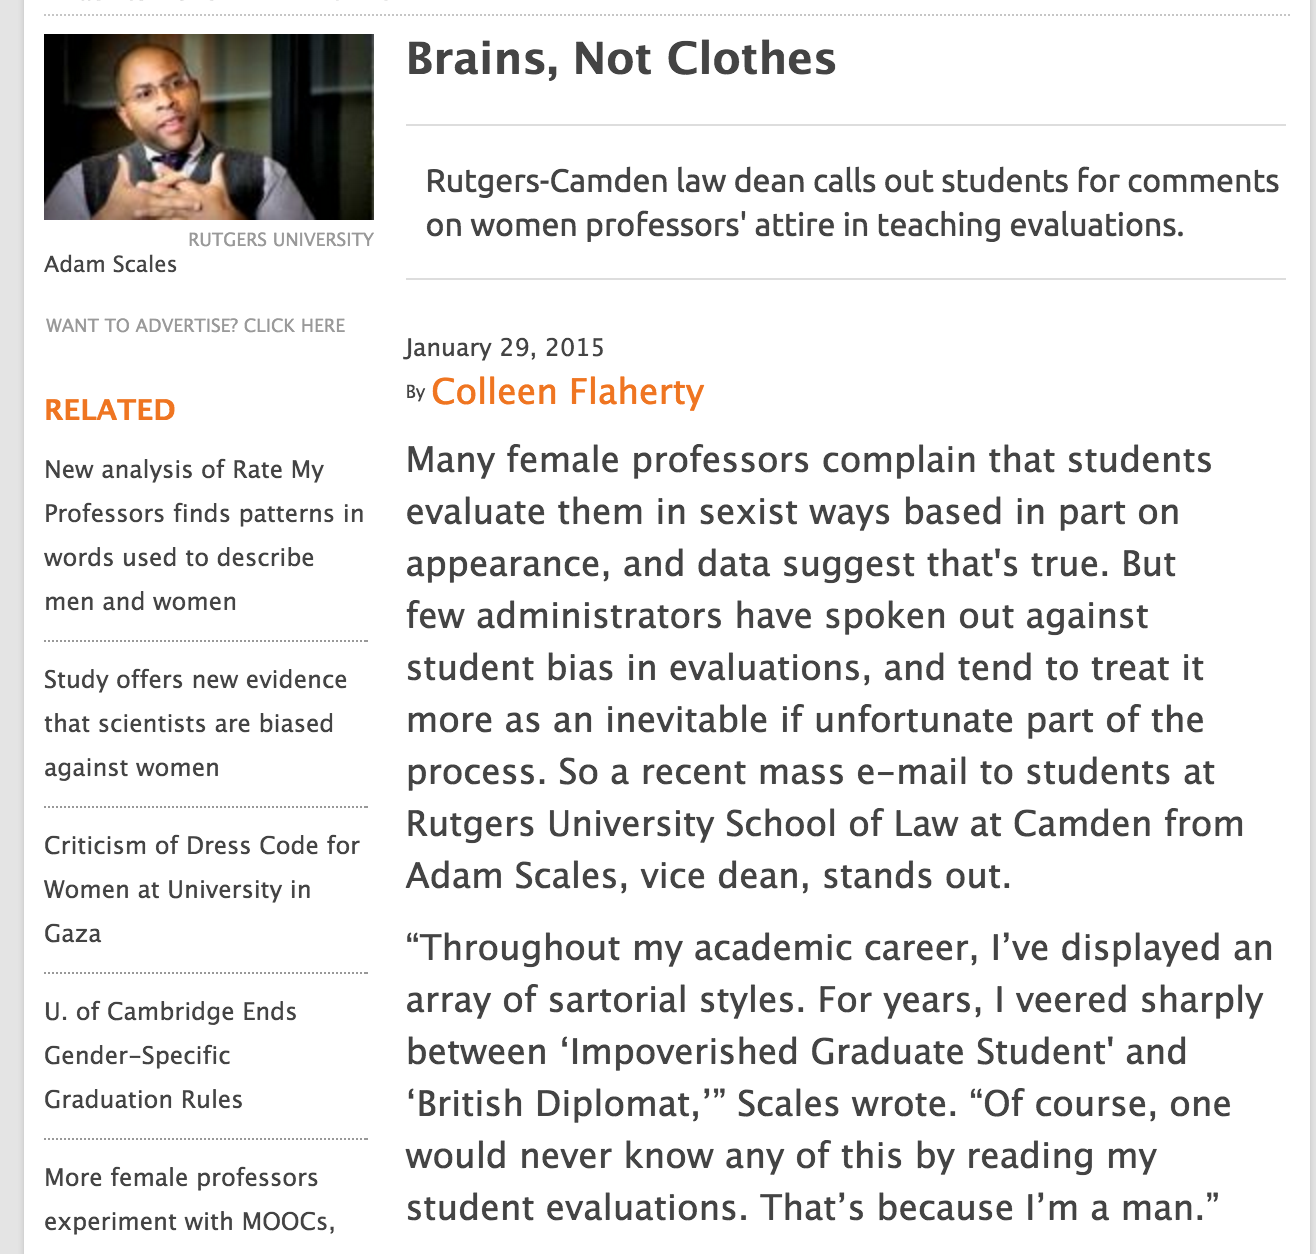 --- #### Adjectival frequency by gender on RateMyProfessor ([Ben Schmidt](http://benschmidt.org/profGender/#%7B%22database%22%3A%22RMP%22%2C%22plotType%22%3A%22pointchart%22%2C%22method%22%3A%22return_json%22%2C%22search_limits%22%3A%7B%22word%22%3A%5B%22cold%22%5D%2C%22department__id%22%3A%7B%22%24lte%22%3A25%7D%7D%2C%22aesthetic%22%3A%7B%22x%22%3A%22WordsPerMillion%22%2C%22y%22%3A%22department%22%2C%22color%22%3A%22gender%22%7D%2C%22counttype%22%3A%5B%22WordsPerMillion%22%5D%2C%22groups%22%3A%5B%22department%22%2C%22gender%22%5D%2C%22testGroup%22%3A%22A%22%7D)) 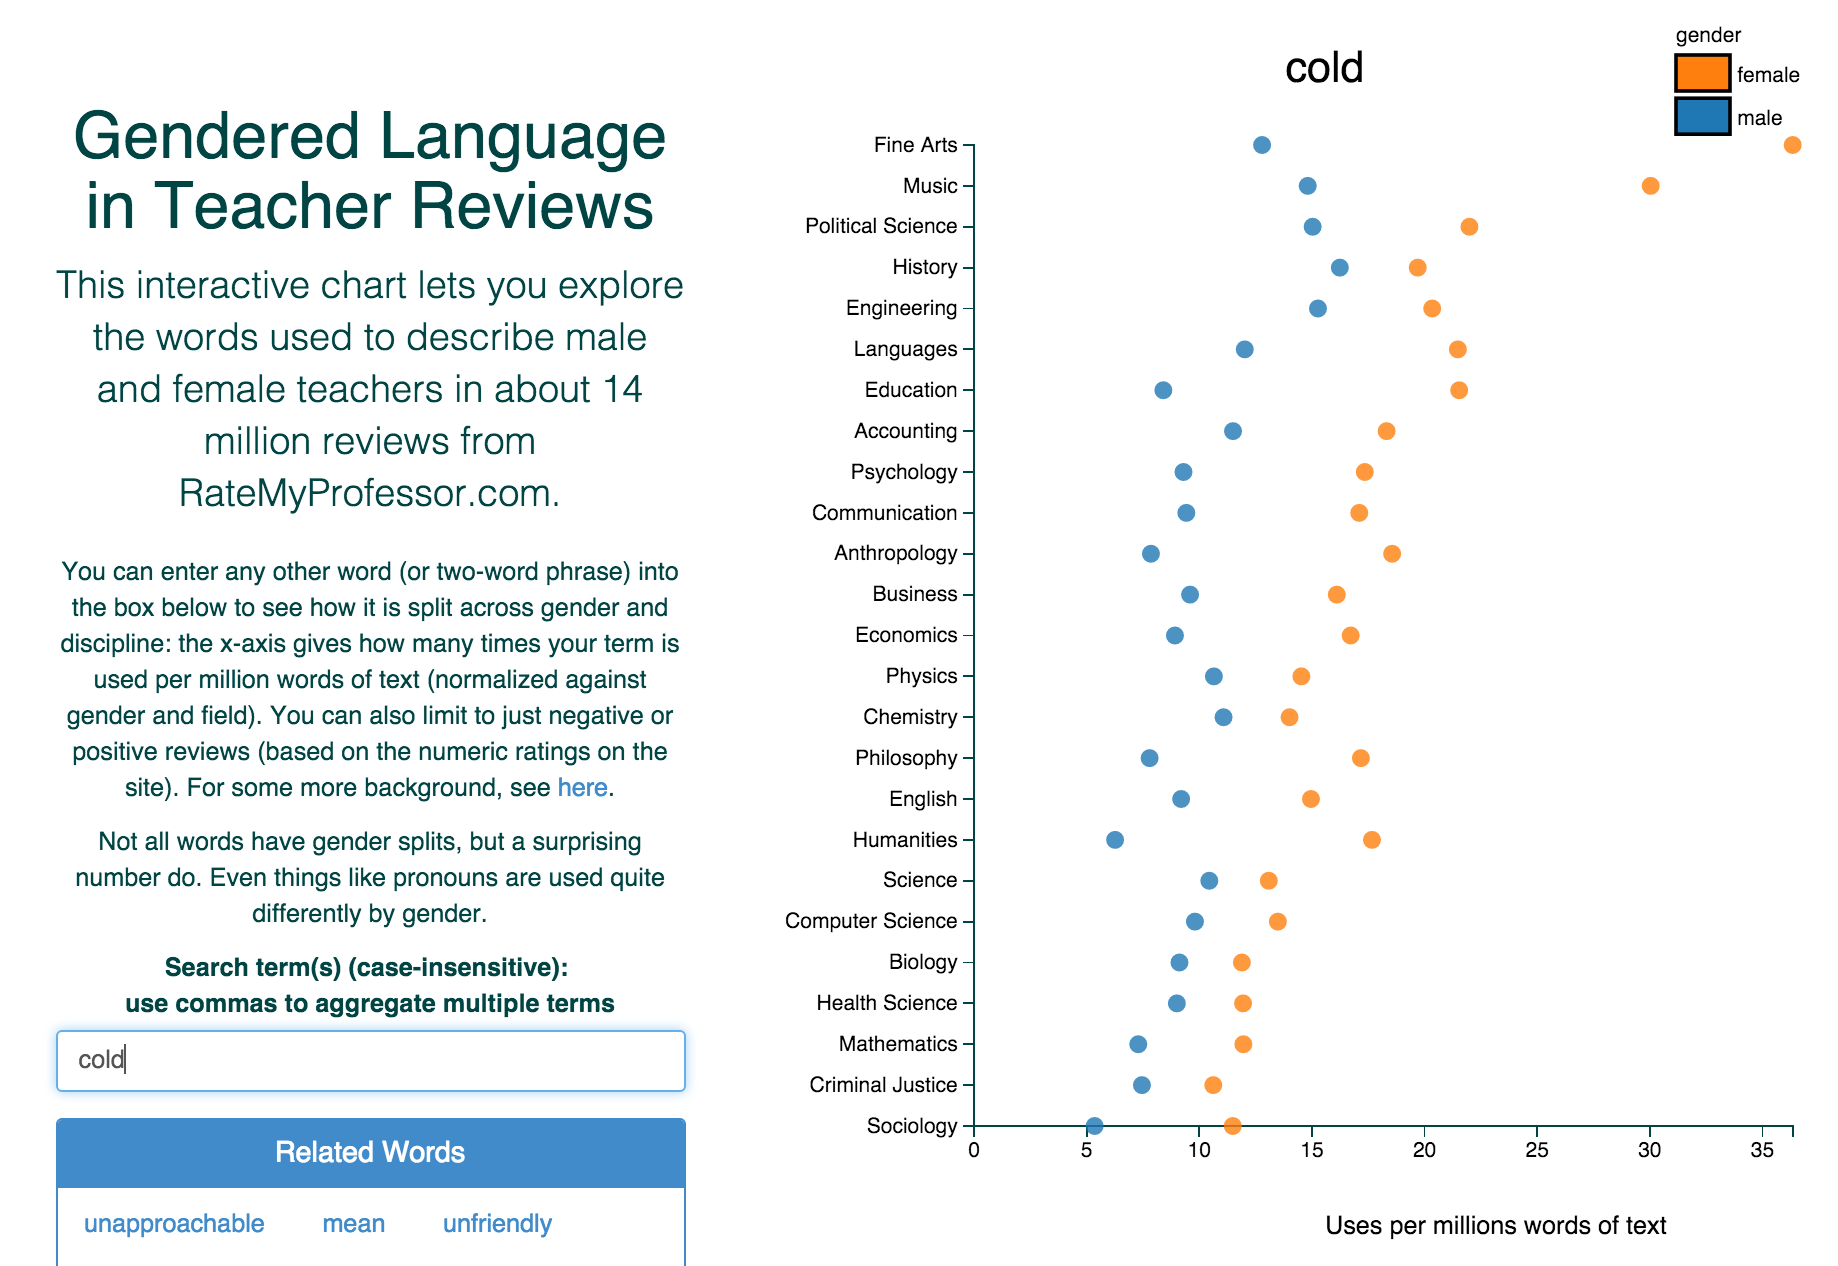 Chili peppers clearly matter for teaching effectiveness. --- #### "She does have an accent, but … " [Subtirelu 2015](doi:10.1017/S0047404514000736) 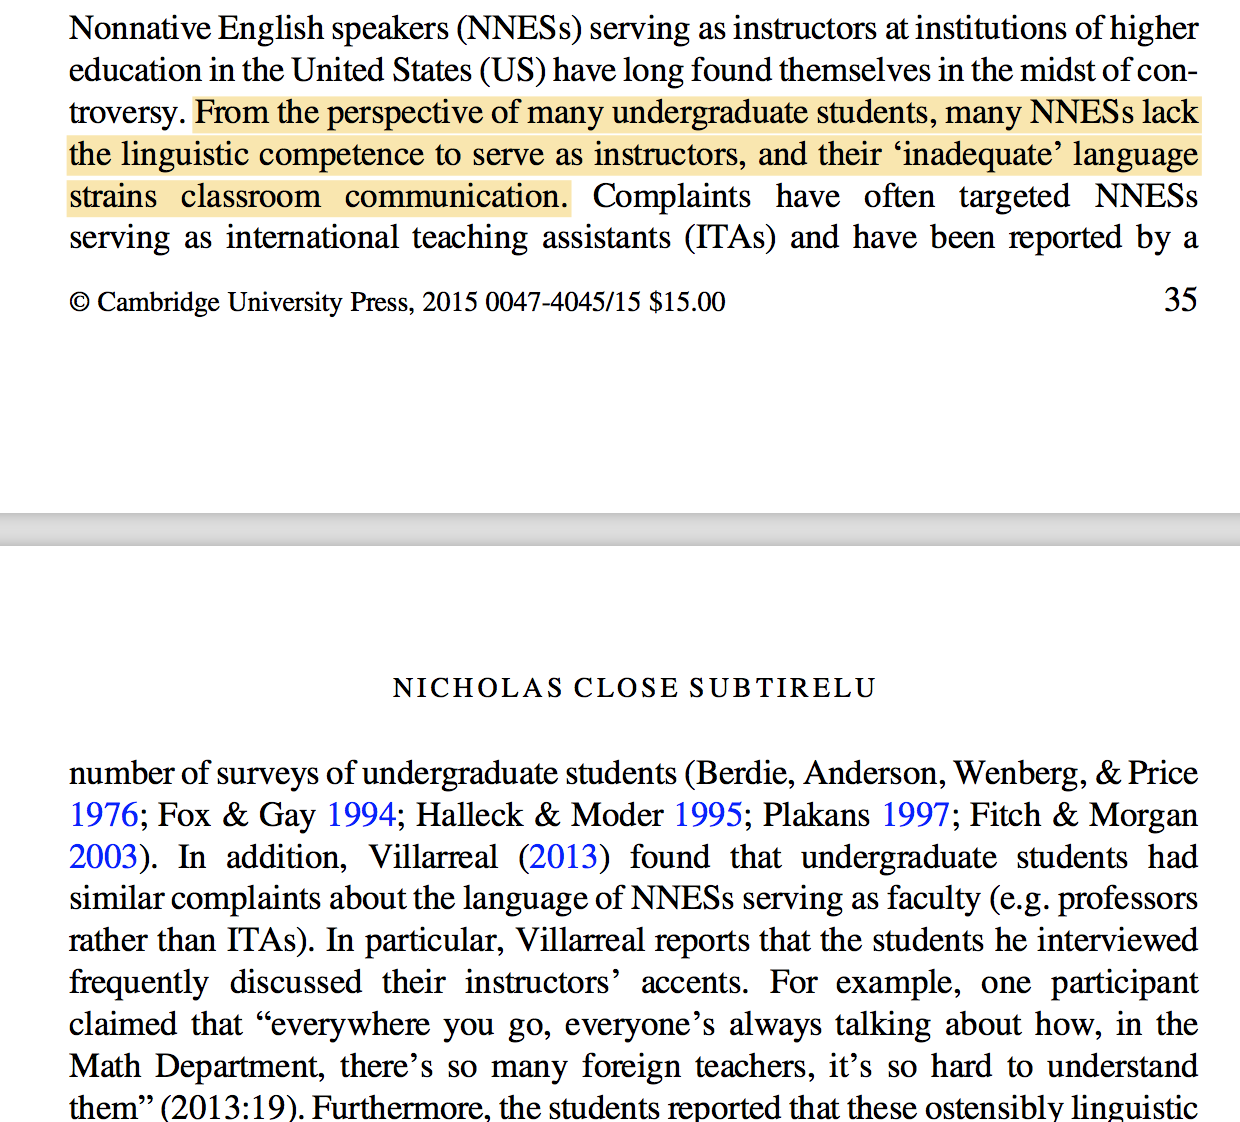 --- ## What do SET measure? - .blue[SET scores are highly correlated with students' grade expectations]<br /> Boring et al., 2016; Johnson, 2003; Marsh & Cooper, 1980; Short et al., 2012; Worthington, 2002 -- - .blue[SET scores & enjoyment scores highly correlated]<br /> Stark, unpublished, 2014 -- - .blue[instructor gender, ethnicity, attractiveness, & age matter]<br /> Anderson & Miller, 1997; Ambady & Rosenthal, 1993; Arbuckle & Williams, 2003; Basow, 1995; Boring, 2014; Boring et al., 2016; Cramer & Alexitch, 2000; Marsh & Dunkin, 1992; MacNell et al., 2014; Wachtel, 1998; Weinberg et al., 2007; Worthington, 2002 -- - .blue[omnibus questions about curriculum design, effectiveness, etc. appear most influenced by factors unrelated to learning]<br /> Worthington, 2002 --- ## Silence is golden?<br />Attractiveness matters 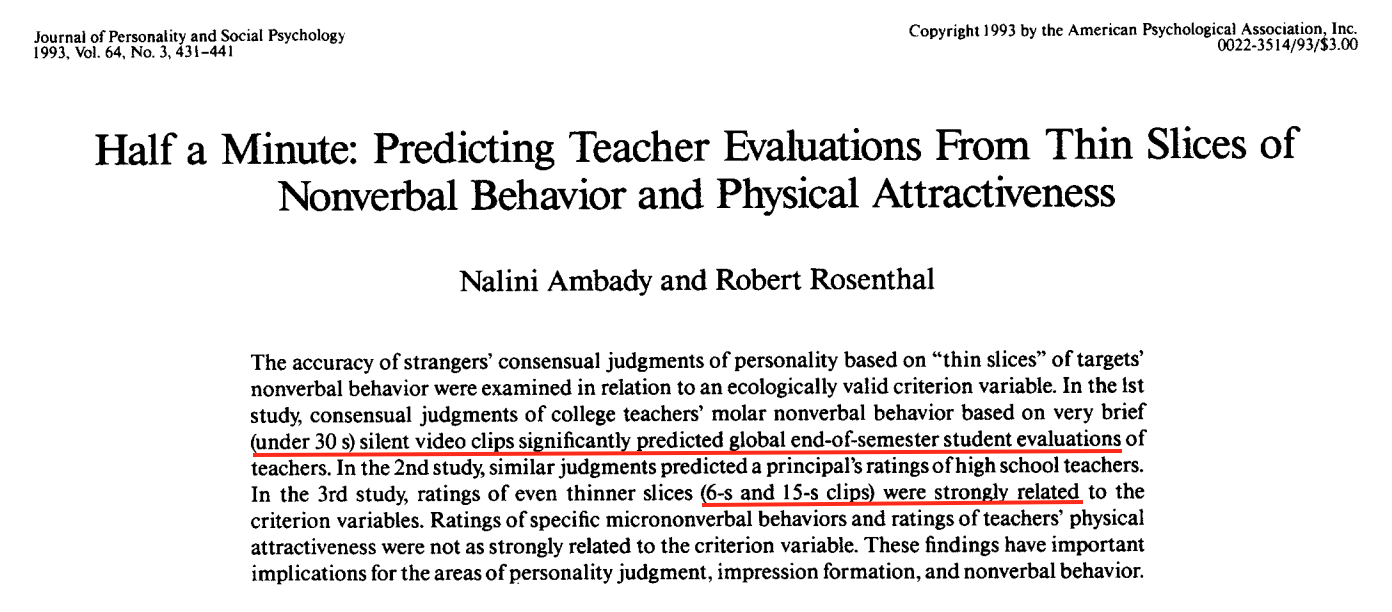 --- ## Reality is cartoonish 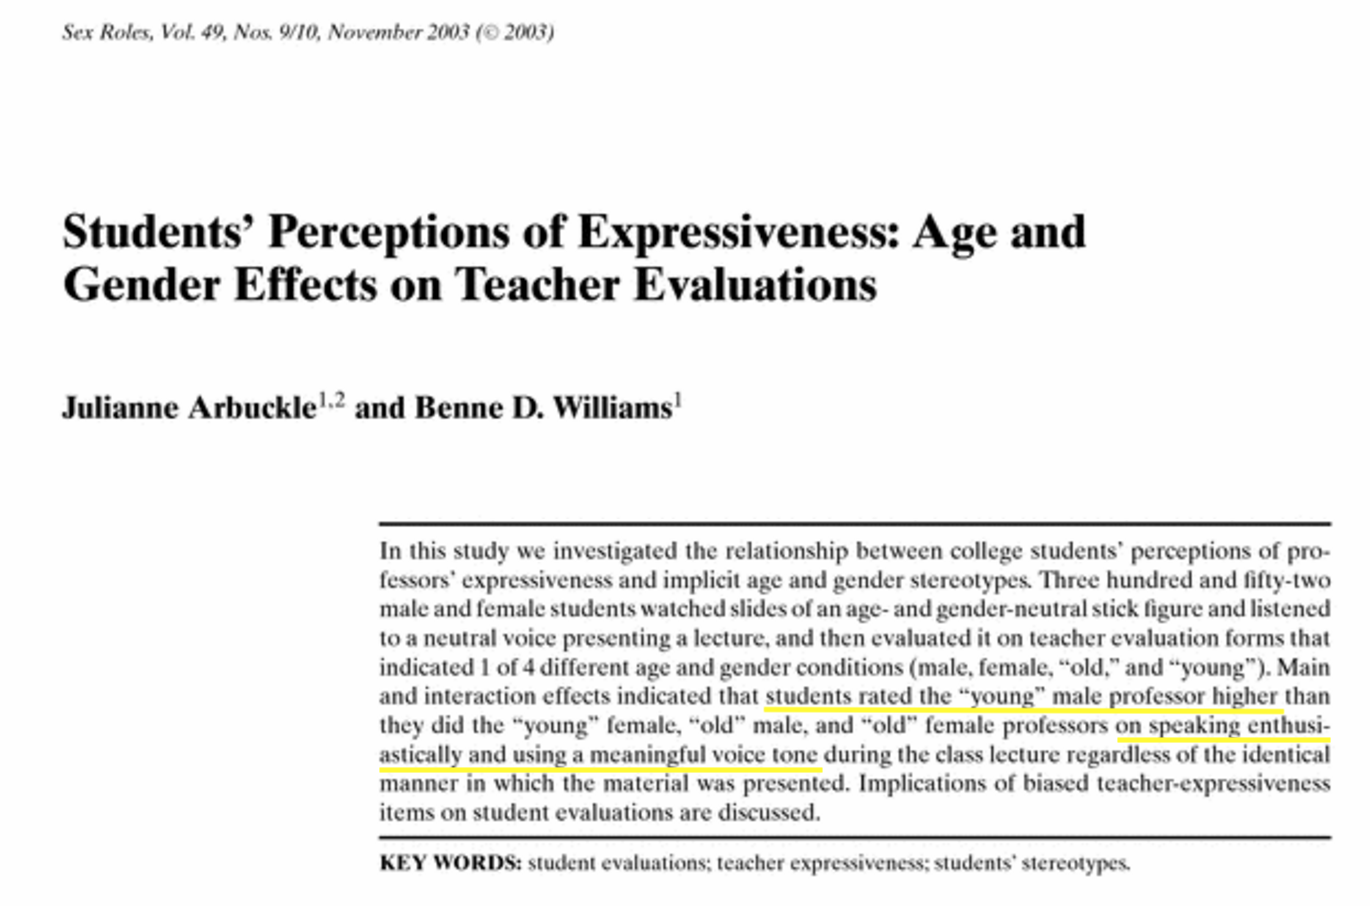 --- ## Experiments are the gold standard Three randomized, controlled experiments: .framed.looser[ .blue[ + The US Air Force Academy: Carrell & West, 2008 + Bocconi University, Milan: Braga, Paccagnella, & Pellizzari, 2011 + NC State online course: MacNell, Driscoll, & Hunt, 2014 ]] Also "natural experiment": .framed.looser[ .blue[ + SciencesPo: Boring, 2014 ]] --- 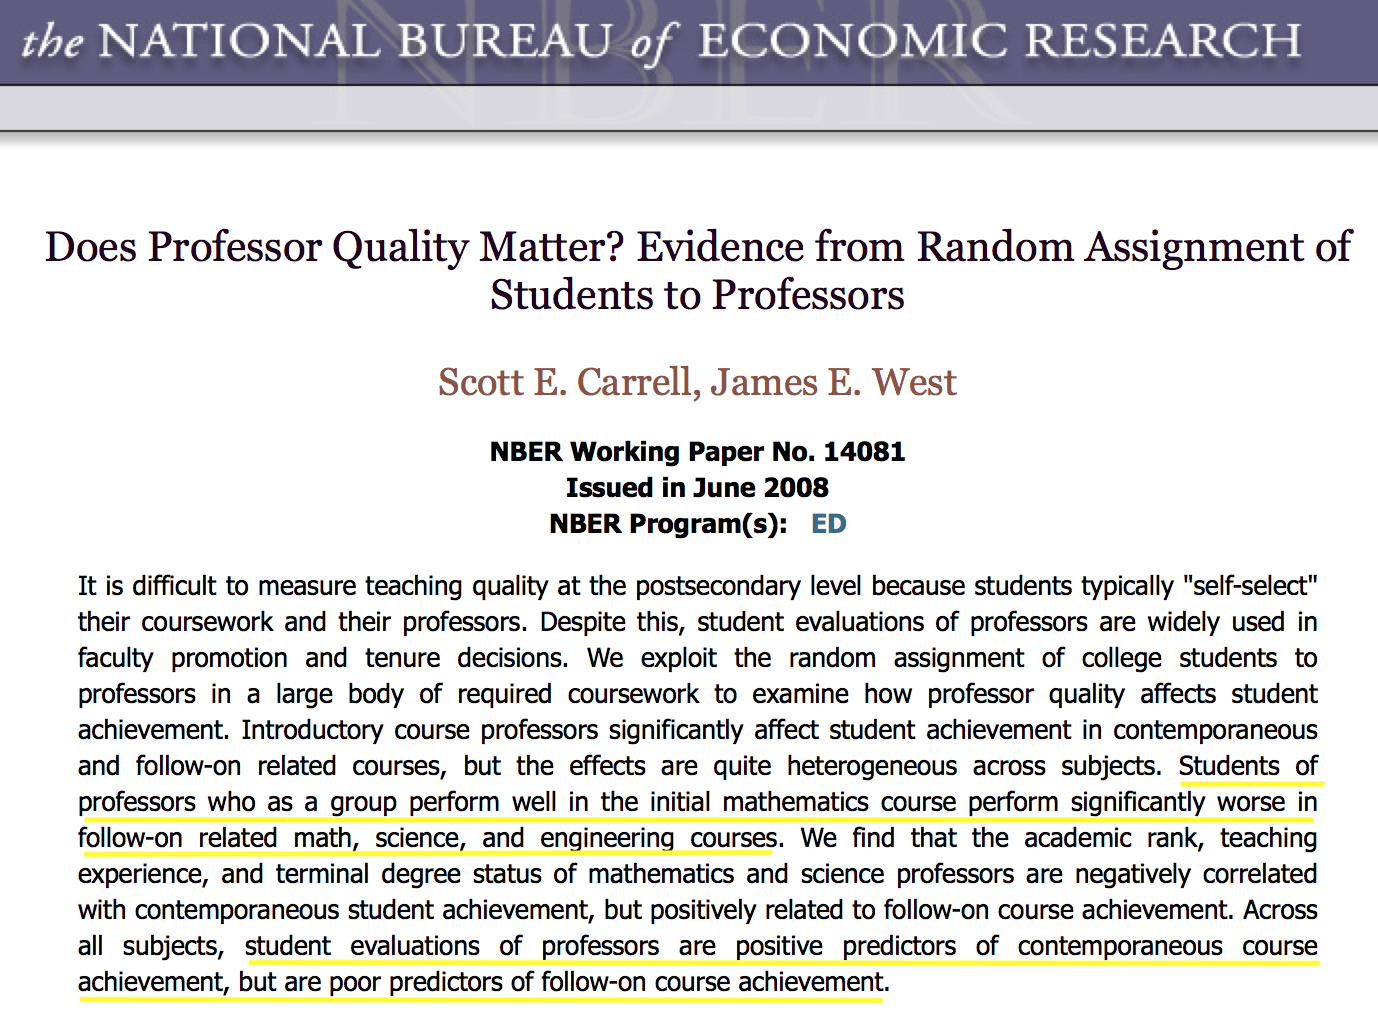 .blue["students appear to reward higher grades in the introductory course but punish professors who increase deep learning"] ---  .blue["teachers who are associated with better subsequent performance receive wors[e] evaluations from their students. On the other hand, teachers who are associated with high grades in their own exams rank higher in the students' evaluations."] --- 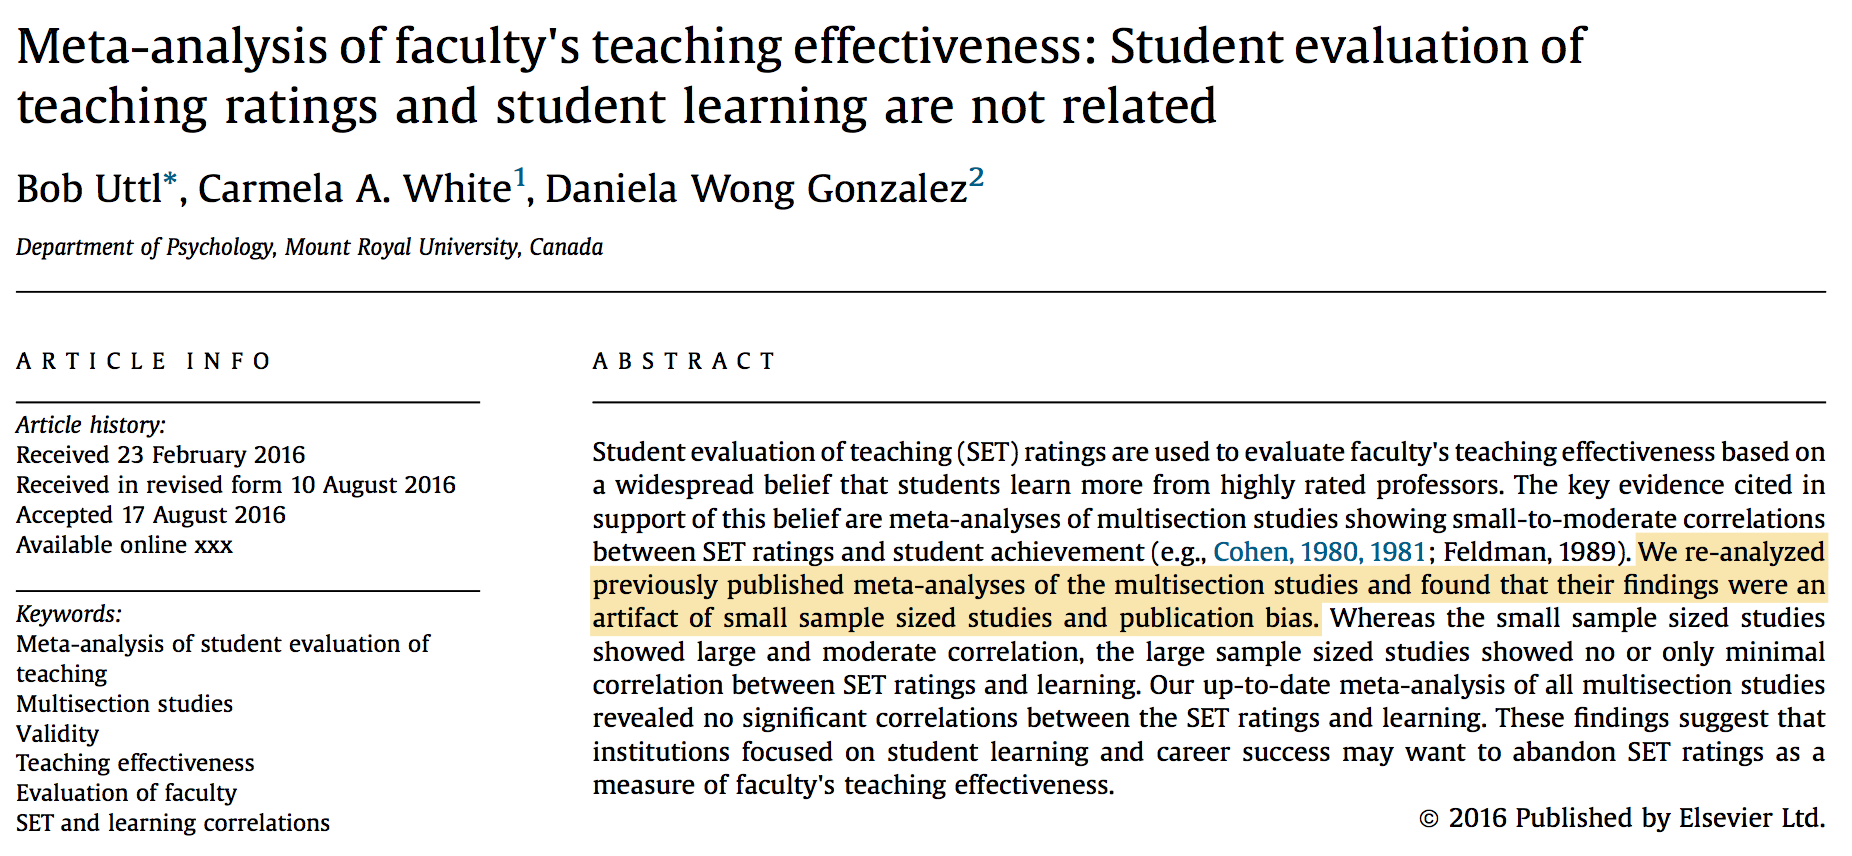 .blue["institutions focused on student learning and career success may want to abandon SET ratings as a measure of faculty's teaching effectiveness"] --- .left-column[ [MacNell, Driscoll, & Hunt, 2014](http://link.springer.com/article/10.1007/s10755-014-9313-4) NC State online course. Students randomized into 6 groups, 2 taught by primary prof, 4 by GSIs. 2 GSIs: 1 male 1 female. GSIs used actual names in 1 section, swapped names in 1 section. 5-point scale. ] .right-column[ .small[ <table> <tr><th> Characteristic</th> <th>M - F</th> <th>perm \(P\)</th> <th>t-test \(P\)</th></tr> <tr><td>Overall </td><td> 0.47 </td><td> 0.12 </td><td> 0.128 </td></tr> <tr><td>Professional </td><td> 0.61 </td><td> 0.07 </td><td> 0.124 </td></tr> <tr><td>Respectful </td><td> 0.61 </td><td> 0.06 </td><td> 0.124 </td></tr> <tr><td>Caring </td><td> 0.52 </td><td> 0.10 </td><td> 0.071 </td></tr> <tr><td>Enthusiastic </td><td> 0.57 </td><td> 0.06 </td><td> 0.112 </td></tr> <tr><td>Communicate </td><td> 0.57 </td><td> 0.07 </td><td> NA </td></tr> <tr><td>Helpful </td><td> 0.46 </td><td> 0.17 </td><td> 0.049 </td></tr> <tr><td>Feedback </td><td> 0.47 </td><td> 0.16 </td><td> 0.054 </td></tr> <tr><td>Prompt </td><td> 0.80 </td><td> 0.01 </td><td> 0.191 </td></tr> <tr><td>Consistent </td><td> 0.46 </td><td> 0.21 </td><td> 0.045 </td></tr> <tr><td>Fair </td><td> 0.76 </td><td> 0.01 </td><td> 0.188 </td></tr> <tr><td>Responsive </td><td> 0.22 </td><td> 0.48 </td><td> 0.013 </td></tr> <tr><td>Praise </td><td> 0.67 </td><td> 0.01 </td><td> 0.153 </td></tr> <tr><td>Knowledge </td><td> 0.35 </td><td> 0.29 </td><td> 0.038 </td></tr> <tr><td>Clear </td><td> 0.41 </td><td> 0.29 </td><td> NA </td></tr> </table> ] ] --- ### Omnibus tests 99% confidence intervals for \\(P\\) 1. perceived instructor gender plays no role \\([0.0, 5.3\times 10^{-5}]\\) 2. male students rate perceived male and female instructors the same \\([0.460, 0.468]\\) 3. female students rate perceived male and female instructors the same \\([0.0, 5.3\times 10^{-5}]\\) --- ### Exam performance and instructor gender Mean grade and instructor gender (male minus female) <table> <tr><th> </th><th> difference in means </th><th> \(P\)-value </th></tr> <tr><td> Perceived </td><td> 1.76 </td><td> 0.54 </td></tr> <tr><td> Actual </td><td> -6.81 </td><td> 0.02 </td></tr> </table> --- ### Boring et al., 2016. SciencesPo data 5 years of data for 6 mandatory freshman classes: History, Political Institutions, Microeconomics, Macroeconomics, Political Science, Sociology + SET mandatory; response rate nearly 100% + anonymous final exams except PI + interim grades before final + 23,001 SET + 379 instructors + 4,423 students + 1,194 sections (950 without PI) + 21 year-by-course strata --- ### Test statistics Correlation between SET and gender within each stratum, averaged across strata. Correlation between SET and average final exam score within each stratum, averaged across strata. --- ### SciencesPo data Average correlation between SET and final exam score <table> <tr><th> </th><th> strata </th><th> \(\bar{\rho}\) </th><th> \(P\) </th></tr> <tr><td>Overall </td><td> 26 (21) </td><td> 0.04 </td><td> 0.09 </td></tr> <tr><td>History </td><td> 5 </td><td> 0.16 </td><td> 0.01 </td></tr> <tr><td>Political Institutions </td><td> 5 </td><td> N/A </td><td> N/A </td></tr> <tr><td>Macroeconomics </td><td> 5 </td><td> 0.06 </td><td> 0.19 </td></tr> <tr><td>Microeconomics </td><td> 5 </td><td> -0.01 </td><td> 0.55 </td></tr> <tr><td>Political science </td><td> 3 </td><td> -0.03 </td><td> 0.62 </td></tr> <tr><td>Sociology </td><td> 3 </td><td> -0.02 </td><td> 0.61 </td></tr> </table> --- Average correlation between SET and instructor gender <table> <tr><th> </th><th> \(\bar{\rho}\) </th><th> \(P\) </th></tr> <tr><td>Overall </td><td> 0.09 </td><td> 0.00 </td></tr> <tr><td>History </td><td> 0.11 </td><td> 0.08 </td></tr> <tr><td>Political institutions </td><td> 0.11 </td><td> 0.10 </td></tr> <tr><td>Macroeconomics </td><td> 0.10 </td><td> 0.16 </td></tr> <tr><td>Microeconomics </td><td> 0.09 </td><td> 0.16 </td></tr> <tr><td>Political science </td><td> 0.04 </td><td> 0.63 </td></tr> <tr><td>Sociology </td><td> 0.08 </td><td> 0.34 </td></tr> </table> --- Average correlation between final exam scores and instructor gender <table> <tr><th> </th><th> \(\bar{\rho}\) </th><th> \(P\) </th></tr> <tr><td>Overall </td><td> -0.06 </td><td> 0.07 </td></tr> <tr><td>History </td><td> -0.08 </td><td> 0.22 </td></tr> <tr><td>Macroeconomics </td><td> -0.06 </td><td> 0.37 </td></tr> <tr><td>Microeconomics </td><td> -0.06 </td><td> 0.37 </td></tr> <tr><td>Political science </td><td> -0.03 </td><td> 0.70 </td></tr> <tr><td>Sociology </td><td> -0.05 </td><td> 0.55 </td></tr> </table> --- Average correlation between SET and gender concordance <table> <tr><th> </th><th colspan="2"> Male student </th><th> </th><th colspan="2">Female student </th></tr> <tr><th></th><th> \(\bar{\rho}\) </th><th> \(P\) </th><th></th><th> \(\bar{\rho}\) </th><th> \(P\) </th></tr> <tr><td> Overall </td><td> 0.15 </td><td> 0.00 </td><td> </td><td> 0.05 </td><td> 0.09 </td></tr> <tr><td> History </td><td> 0.17 </td><td> 0.01 </td><td> </td><td> -0.03 </td><td> 0.60 </td></tr> <tr><td> Political institutions </td><td> 0.12 </td><td> 0.08 </td><td> </td><td> -0.11 </td><td> 0.12 </td></tr> <tr><td> Macroeconomics </td><td> 0.14 </td><td> 0.04 </td><td> </td><td> -0.05 </td><td> 0.49 </td></tr> <tr><td> Microeconomics </td><td> 0.18 </td><td> 0.01 </td><td> </td><td> -0.00 </td><td> 0.97 </td></tr> <tr><td> Political science </td><td> 0.17 </td><td> 0.06 </td><td> </td><td> 0.04 </td><td> 0.64 </td></tr> <tr><td> Sociology </td><td> 0.12 </td><td> 0.16 </td><td> </td><td> -0.03 </td><td> 0.76 </td></tr> </table> --- Average correlation between SET and interim grades <table> <tr><th> </th><th> \(\bar{\rho}\) </th><th> \(P\) </th></tr> <tr><td>Overall </td><td> 0.16 </td><td> 0.00 </td></tr> <tr><td>History </td><td> 0.32 </td><td> 0.00 </td></tr> <tr><td>Political institutions </td><td> -0.02 </td><td> 0.61 </td></tr> <tr><td>Macroeconomics </td><td> 0.15 </td><td> 0.01 </td></tr> <tr><td>Microeconomics </td><td> 0.13 </td><td> 0.03 </td></tr> <tr><td>Political science </td><td> 0.17 </td><td> 0.02 </td></tr> <tr><td>Sociology </td><td> 0.24 </td><td> 0.00 </td></tr> </table> --- ### What are we measuring? US data: controls for _everything_ but the name, since compares each TA to him/herself. French data: controls for subject, year, teaching effectiveness --- ### Who supports SET? .framed[ .blue[ >> It is difficult to get a man to understand something, when his salary depends upon his not understanding it! —Upton Sinclair ] ] --- ### Benton & Cashin, 2012: exemplar SET apologists + Widely cited, but it's a technical report from IDEA, a business that sells SET. -- + Claims SET are reliable and valid. -- + Does not cite Carrell & West (2008) or Braga et al. (2011), the only two randomized experiments I know of published before B&C (2012) -- + As far as I can tell, no study B&C cite in support of validity used randomization. --- #### Again, address a straw man hypothesis: - Who claims SET have **absolutely no connection** to teaching effectiveness? -- - SET are associated with class enjoyment, which may affect engagement & learning >UCB Dept. Stat, fall 2012, 1486 students rated instructor overall effectiveness & enjoyment of the course. -- .blue[ > Correlation btw instructor effectiveness & enjoyment: 0.75.<br /> Correlation btw course effectiveness & enjoyment: 0.8. ] -- - .red[question is not whether there's _any_ association between SET and effectiveness.] .blue[question is _how well_ SET measure effectiveness, and whether factors unrelated to effectiveness are confounded enough that SET is misleading or discriminatory] -- + Association at the student level Benton et al. find means individual students who rate _the same instructor_ higher get higher scores. -- + Seems to show SET are not reliable! --- ## What's the right question? + Are SET more sensitive to effectiveness or to something else? + Do women and men get comparable SET? + But for their gender, would women get higher SET than they do? (And but for their gender, would men get lower SET than they do?) Need to compare like teaching with like teaching, not an arbitrary collection of women with an arbitrary collection of men. Boring (2014) finds _costs_ of improving SET very different for men and women. --- ## These are not the only biases! + Ethnicity and race + Age + Attractiveness + Accents / non-native English speakers ... --- ### SET do not measure teaching effectiveness + Calling something "teaching effectiveness" does not make it so + Averaging Likert ratings doesn't make sense: scale isn't proportional + Compute averages to 2 decimals doesn't make the averages meaningful or comparable + Courses are largely incommensurable: comparing averages across sizes, levels, disciplines, types of course, electives v. requirements, etc., is silly + .blue[The lawsuits are coming.] --- ### What might we be able to discover about teaching? .looser[ + Is she dedicated to and engaged in her teaching? + Is she available to students? + Is she putting in appropriate effort? Is she creating new materials, new courses, or new pedagogical approaches? + Is she revising, refreshing, and reworking existing courses using feedback and on-going experiment? + Is she helping keep the department's curriculum up to date? + Is she trying to improve? + Is she contributing to the college's teaching mission in a serious way? + Is she supervising undergraduates for research, internships, and honors theses? + Is she advising and mentoring students? + Do her students do well when they graduate? ] --- ### UCB Dept of Statistics policy since 2013 -- + Candidates prepare a teaching portfolio, including teaching statement, syllabi, notes, websites, assignments, exams, videos, statements on mentoring, & anything else the candidate wants to include. -- + Dept. chair & promotion committee assess portfolio. -- + Peer observation: before every "milestone” review (mid-career, tenure, full, step VI), observe at least 1 class -- + Report response rates & distributions of SET, but not average SET. -- + Summarize themes of comments. --- ### How hard/expensive is it? .blue[Classroom observation took the reviewer about four hours, including the observation time itself.] Process included conversations between the candidate and the observer, opportunity for the candidate to respond to the written comments, & provision for a "no-fault do-over." -- .blue[If done for every milestone review, would be ≈16h over a 40-year career.] Candidates & reviewer reported that the process was valuable and interesting. Based on that experience, the dean recommended peer observation prior to milestone reviews; the next dean reversed that decision. -- Room for improvement: Observing >1 class and >1 course would be better. Adding informal observation and discussion between reviews would be better. Periodic surveys of former students, advisees, and teaching assistants would be useful. -- But still this improves on using SET alone. --- ### Tips 1. See pp.4-5 of APM-210 http://www.ucop.edu/academic-personnel-programs/_files/apm/apm-210.pdf 2. Don't use SET for employment decisions. Comments might be useful to instructor, but shouldn't be part of the materials considered for appointment, reappointment, merit reviews, tenure, or promotions. 3. Easier to document/measure inputs than outputs. 1. Self-statements & self-inventories 2. Teaching dossiers w/ artifacts instructor wants considered: syllabi, assignments, exams, student work, lecture notes, instructional websites, textbooks; course approval forms for new courses; advisee successes; undergraduate supervision; teaching short courses; etc.<br />Recommended by APM-210 3. Lecture recordings, so others can observe teaching & interaction with students. Allows the chair, ad hoc committee, et al. to assess evidence 4. Peer observation. E.g., http://teaching.berkeley.edu/peer-review-course-instruction. 5. Comments from GSIs and former advisees. (Document selection process.) --- ### Logistics - Managing and minimizing the workload required for better evaluation. + Campus could provide technology to help construct dossiers, collect online materials, etc. + Dossiers are relatively easy to maintain, once created. + Interview GSIs about more than one class at a time. + Campus funding for video recording of classes? - Other steps to improve teaching + Encourage faculty to visit each others' classes and discuss pedagogy. + Establish formal teaching mentorships for beginning instructors, including reviewing syllabi, observing lectures, etc. --- ### How can students help evaluate teaching? Report their own experience of the class. + Did you enjoy the class? + Compared to other classes, was the class easy or hard? Interesting or boring? Time-consuming? + Are you more enthusiastic or less enthusiastic about the subject matter after taking the class? + What was your favorite part of the course? + What was your least favorite part of the course? + Would you recommend this course to other students? Why or why not? + If this was an elective: - did you plan to take a sequel before taking this course? - do you now plan to take a sequel course? + Could you hear the instructor's voice? + Was the instructor's handwriting legible? --- ### Meta-message + It's easy to think we're being objective and rational when we base our decisions on quantitative data. -- + But if the data are subjective (or low quality) or not well connected to the goal, it's irrational to rely on them: they are unfit for the purpose. -- + It may be far better to use a qualitative approach involving careful observation and judgement. -- + Measuring inputs reasonably might be better than pretending to measure outputs. -- .framed.looser.red[ + Not all evidence is numerical. + Not all numbers are evidence. + Beware quantifauxcation! ] --- #### References + Ambady, N., and R. Rosenthal, 1993. Half a Minute: Predicting Teacher Evaluations from Thin Slices of Nonverbal Behavior and Physical Attractiveness, _J. Personality and Social Psychology_, _64_, 431-441. + Arbuckle, J. and B.D. Williams, 2003. Students' Perceptions of Expressiveness: Age and Gender Effects on Teacher Evaluations, _Sex Roles_, _49_, 507-516. DOI 10.1023/A:1025832707002 + Archibeque, O., 2014. Bias in Student Evaluations of Minority Faculty: A Selected Bibliography of Recent Publications, 2005 to Present. http://library.auraria.edu/content/bias-student-evaluations-minority-faculty (last retrieved 30 September 2016) + Basow, S., S. Codos, and J. Martin, 2013. The Effects of Professors' Race and Gender on Student Evaluations and Performance, _College Student Journal_, _47_ (2), 352-363. + Boring, A., 2015. Gender Bias in Student Evaluations of Teachers, OFCE-PRESAGE-Sciences-Po Working Paper, http://www.ofce.sciences-po.fr/pdf/dtravail/WP2015-13.pdf (last retrieved 30 September 2016) + Boring, A., K. Ottoboni, and P.B. Stark, 2016. Student Evaluations of Teaching (Mostly) Do Not Measure Teaching Effectiveness, _ScienceOpen_, DOI 10.14293/S2199-1006.1.SOR-EDU.AETBZC.v1 + Braga, M., M. Paccagnella, and M. Pellizzari, 2014. Evaluating Students' Evaluations of Professors, _Economics of Education Review_, _41_, 71-88. + Carrell, S.E., and J.E. West, 2010. Does Professor Quality Matter? Evidence from Random Assignment of Students to Professors, _J. Political Economy_, _118_, 409-432. --- + Johnson, V.E., 2003. Grade Inflation: A Crisis in College Education, Springer-Verlag, NY, 262pp. + Lauer, C., 2012. A Comparison of Faculty and Student Perspectives on Course Evaluation Terminology, in _To Improve the Academy: Resources for Faculty, Instructional, and Educational Development_, _31_, J.E. Groccia and L. Cruz, eds., Jossey-Bass, 195-211. + MacNell, L., A. Driscoll, and A.N. Hunt, 2015. What's in a Name: Exposing Gender Bias in Student Ratings of Teaching, _Innovative Higher Education_, _40_, 291-303. DOI 10.1007/s10755-014-9313-4 + Schmidt, B., 2015. Gendered Language in Teacher Reviews, http://benschmidt.org/profGender (last retrieved 30 September 2016) + Stark, P.B., and R. Freishtat, 2014. An Evaluation of Course Evaluations, _ScienceOpen_, DOI 10.14293/S2199-1006.1.SOR-EDU.AOFRQA.v1 + Subtirelu, N.C., 2015. "She does have an accent but…": Race and language ideology in students' evaluations of mathematics instructors on RateMyProfessors.com, _Language in Society_, _44_, 35-62. DOI 10.1017/S0047404514000736 + Uttl, B., C.A. White, and A. Morin, 2013. The Numbers Tell it All: Students Don't Like Numbers!, _PLoS ONE_, _8_ (12): e83443, DOI 10.1371/journal.pone.0083443 + Uttl, B., C.A. White, and D.W. Gonzalez, 2016. Meta-analysis of Faculty's Teaching Effectiveness: Student Evaluation of Teaching Ratings and Student Learning Are Not Related, _Studies in Educational Evaluation_, DOI: 0.1016/j.stueduc.2016.08.007