class: blueBack ## Student evaluations of teaching (mostly) do not measure teaching effectiveness ### Simon Fraser University<br />Burnaby, BC<br />26 April 2018 #### Philip B. Stark<br /> Department of Statistics <br /> University of California, Berkeley<br />http://www.stat.berkeley.edu/~stark | [@philipbstark](https://twitter.com/philipbstark) #### Joint work with Anne Boring, Richard Freishtat, Kellie Ottoboni --- <br /> <br /> .framed.center.large.blue.vcenter[***The truth will set you free, but first it will piss you off.***] <br /> .align-right.medium[—Gloria Steinem] --- <br /> <br /> .framed.center.large.blue.vcenter[***When a measure becomes a target, it ceases to be a good measure.***] <br/> .align-right.medium[—Goodhart's Law (via Marilyn Strathern)] --- ### Student Evaluations of Teaching (SET) + most common method to evaluate teaching + used for hiring, firing, tenure, promotion + simple, cheap, fast to administer -- .center.blue[But what do they tell us about teaching?] --- .center.vcenter.large[Part I: Basic Statistics] --- ### Nonresponse -- + SET surveys are an incomplete census, not a random sample. -- + Suppose 70% of students respond, with an average of 4 on a 7-point scale. -- .red[Then the class average could be anywhere between 3.1 & 4.9] -- + "Margin of error" meaningless: not a random sample -- .center[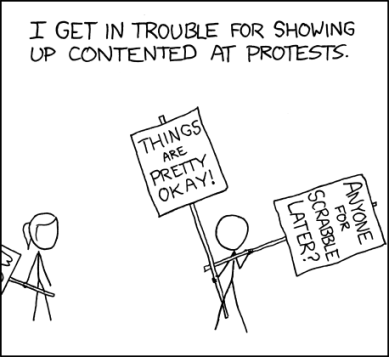] https://xkcd.com/470/ --- ### All our arithmetic is below average + Does a 3 mean the same thing to every student—even approximately? -- + Is a 5 in an upper-division architecture studio the same as a 5 in a required freshman Econ course with 500 students? -- + Is the difference between 1 & 2 the same as the difference between 5 & 6? -- + Does a 1 balance a 7 to make two 4s? -- + what about variability? - (1+1+7+7)/4 = (2+3+5+6)/4 = (1+5+5+5)/4 = (4+4+4+4)/4 = 4 - Polarizing teacher ≠ teacher w/ mediocre ratings - 3 statisticians go deer hunting … --- ### What does the mean mean? .blue[Averages makes sense for interval scales, not ordinal scales like SET.] -- .red[Averaging SET doesn't make sense.] -- Doesn't make sense to compare average SET across: + courses + instructors + levels + types of classes + modes of instruction + disciplines -- Shouldn't ignore variability or nonresponse. --- .center.large.blue.vcenter[***Quantifauxcation***: assign a meaningless number, then conclude that because it's numerical, it means something.] --- .center.vcenter.large[Part II: Science, Sciencism] ---  > If you can't prove what you want to prove, demonstrate something else and pretend they are the same thing. In the daze that follows the collision of statistics with the human mind, hardly anyone will notice the difference. .align-right[Darrell Huff] -- .blue[Hard to measure teaching effectiveness, so instead we measure student opinion (poorly) and pretend they are the same thing.] --- ## What's effective teaching? -- + Should facilitate learning -- + Grades usually not a good proxy for learning -- + Students generally can't judge how much they learned -- + Serious problems with confounding -- 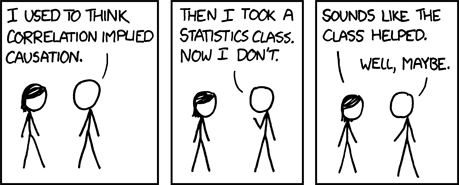 https://xkcd.com/552/ --- ### Lauer, 2012. Survey of 185 students, 45 faculty at Rollins College, FL Faculty & students don't mean the same thing by "fair," "professional," "organized," "challenging," & "respectful" -- <table> <tr><th> <em>not fair</em> means …</th><th>student %</th><th>instructor %</th></tr> <tr><td>plays favorites</td> <td>45.8</td> <td>31.7</td></tr> <tr><td>grading problematic</td> <td>2.3 </td> <td>49.2</td></tr> <tr><td>work is too hard</td> <td>12.7</td> <td>0</td></tr> <tr><td>won't "work with you" on problems</td> <td>12.3</td> <td>0</td></tr> <tr><td>other</td> <td>6.9</td> <td>19</td></tr> </table> --- ### Bias against women & URM: -- + grant applications (e.g., [Kaatz et al., 2014](http://www.ncbi.nlm.nih.gov/pmc/articles/PMC4552397/), [Witteman et al., 2018](https://www.biorxiv.org/content/early/2018/01/19/232868)) -- + letters of recommendation (e.g., [Schmader et al., 2007](http://www.ncbi.nlm.nih.gov/pmc/articles/PMC2572075/), [Madera et al., 2009](http://www.academic.umn.edu/wfc/rec%20letter%20study%202009.pdf)) -- + job applications (e.g., [Moss-Racusin et al., 2012](http://www.pnas.org/content/109/41/16474.abstract), [Reuben et al., 2014](http://www.pnas.org/content/111/12/4403.abstract0)) -- + interruptions of job talks (e.g., [Blair-Loy et al., 2017](doi:10.3390/socsci6010029)) -- + credit for joint work (e.g., [Sarsons, 2015](http://scholar.harvard.edu/files/sarsons/files/gender_groupwork.pdf?m=1449178759)) --- ### Retorts: -- + But I know some women who get great scores & win teaching awards! -- + I know SET aren't perfect, but they must have _some_ connection to effectiveness. -- + I get better SET when I feel the class went better. -- + Shouldn't students have a voice? --- 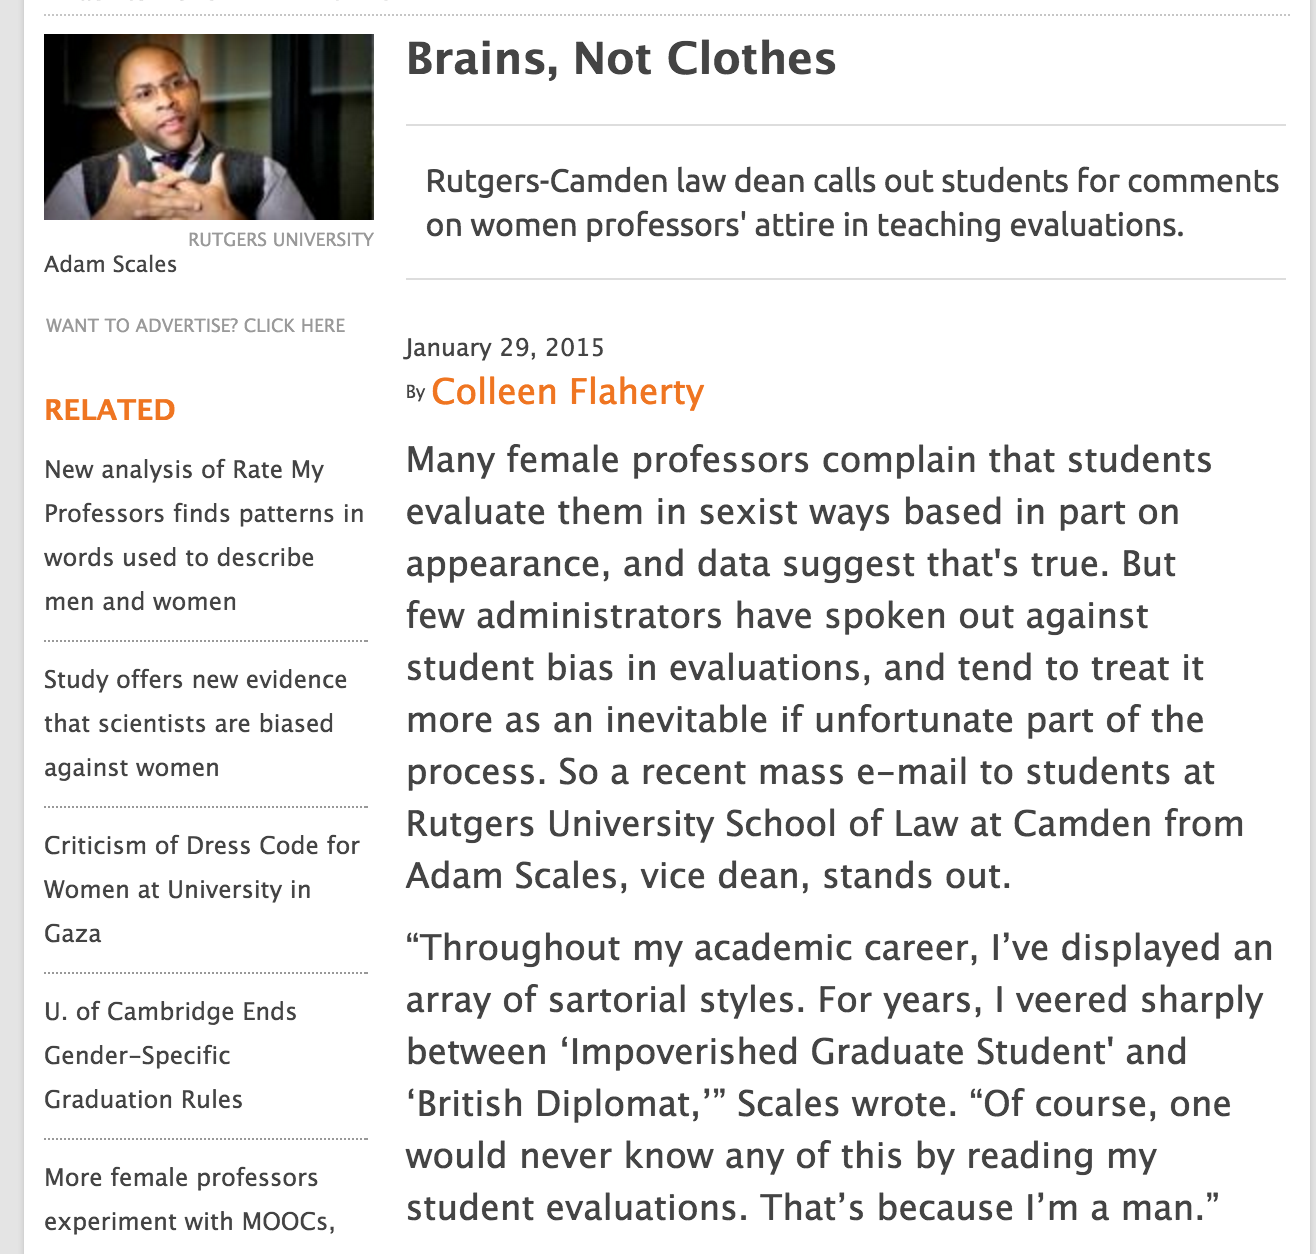 --- ### How much does appearance matter? Consider the source. <iframe width="600" height="400" src="https://www.youtube.com/embed/Xcc1Xz6XYPE?t=1m50s" frameborder="0" allowfullscreen></iframe> --- 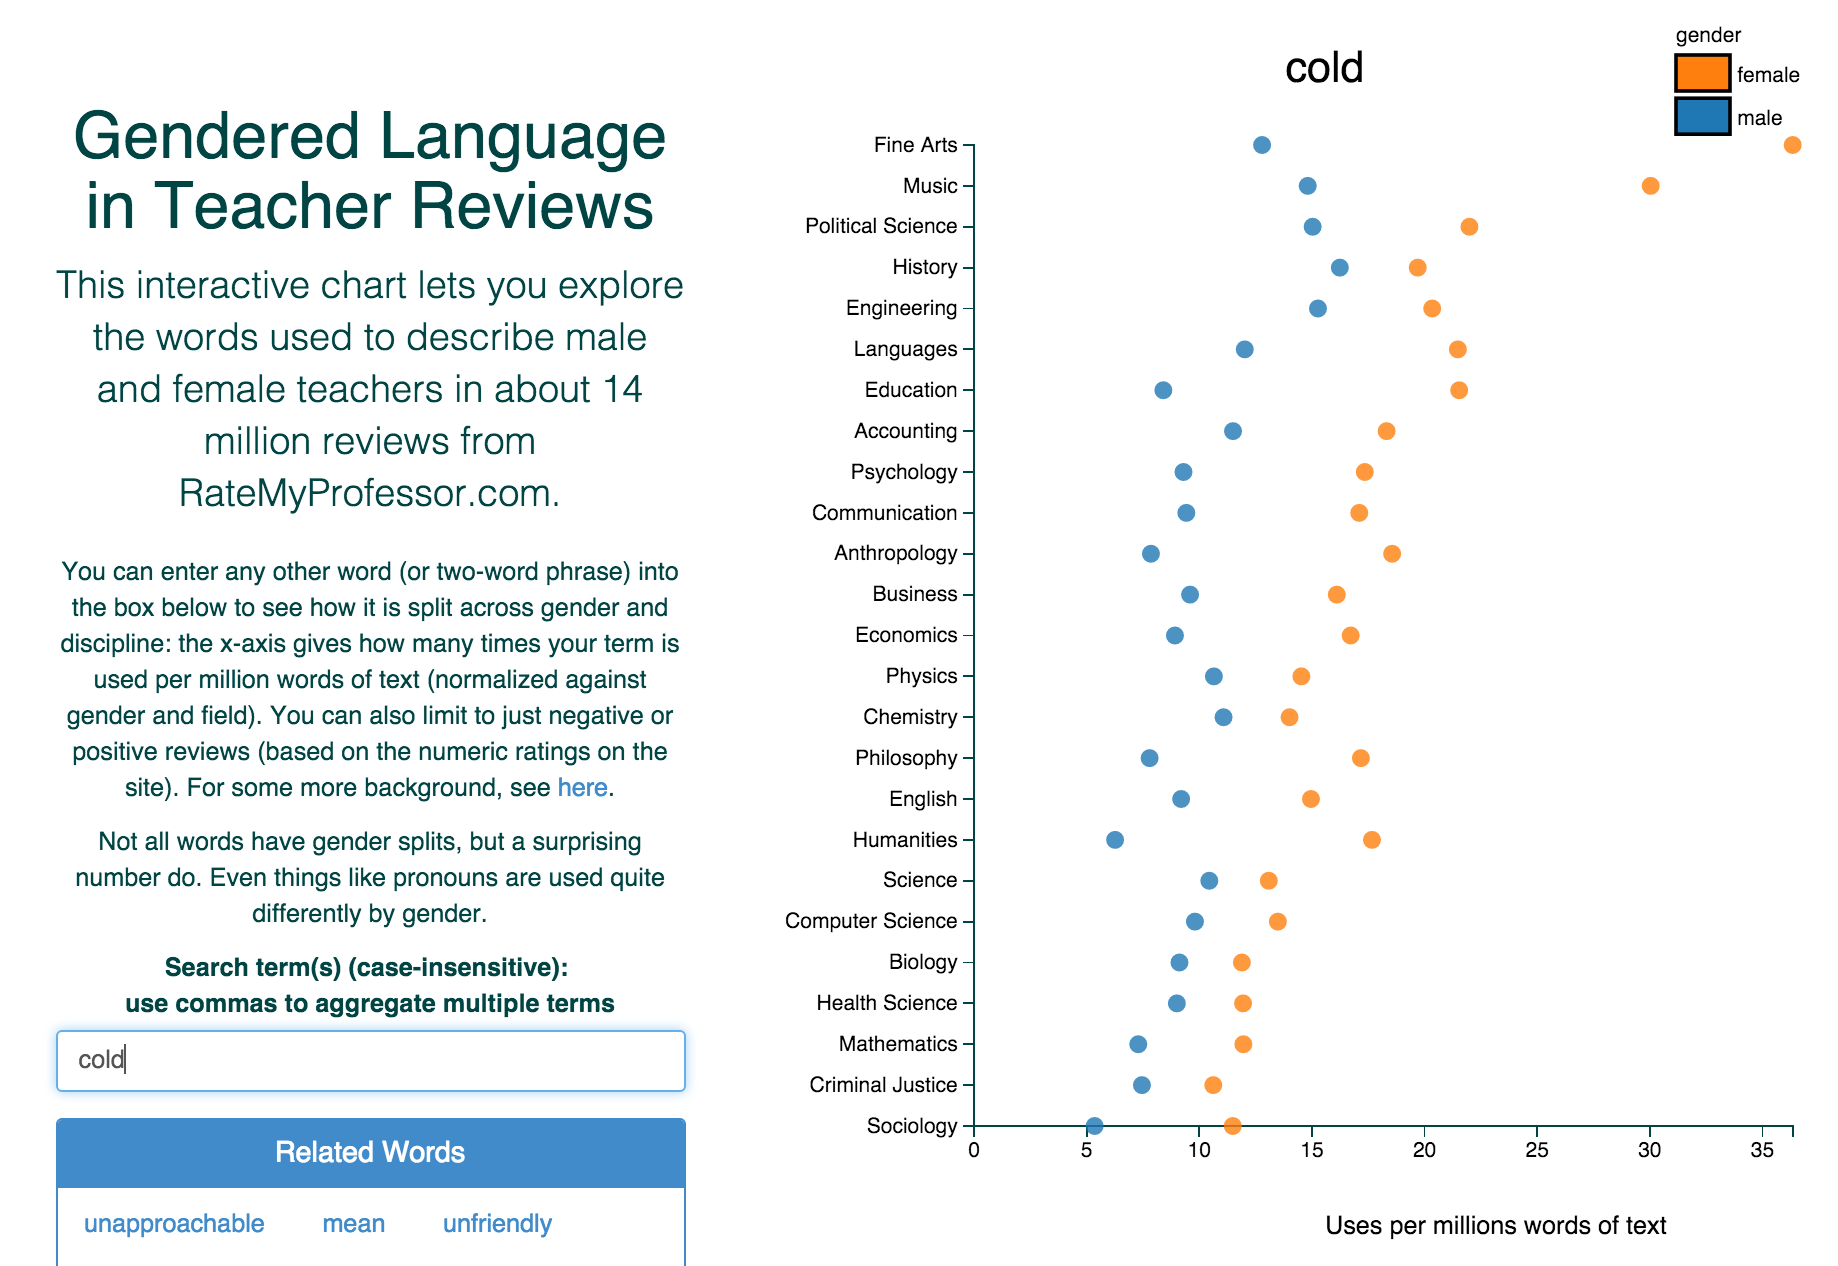 [Ben Schmidt](http://benschmidt.org/profGender/#%7B%22database%22%3A%22RMP%22%2C%22plotType%22%3A%22pointchart%22%2C%22method%22%3A%22return_json%22%2C%22search_limits%22%3A%7B%22word%22%3A%5B%22cold%22%5D%2C%22department__id%22%3A%7B%22%24lte%22%3A25%7D%7D%2C%22aesthetic%22%3A%7B%22x%22%3A%22WordsPerMillion%22%2C%22y%22%3A%22department%22%2C%22color%22%3A%22gender%22%7D%2C%22counttype%22%3A%5B%22WordsPerMillion%22%5D%2C%22groups%22%3A%5B%22department%22%2C%22gender%22%5D%2C%22testGroup%22%3A%22A%22%7D) Chili peppers clearly matter for teaching effectiveness. --- #### "She does have an accent, but … " [Subtirelu 2015](doi:10.1017/S0047404514000736) 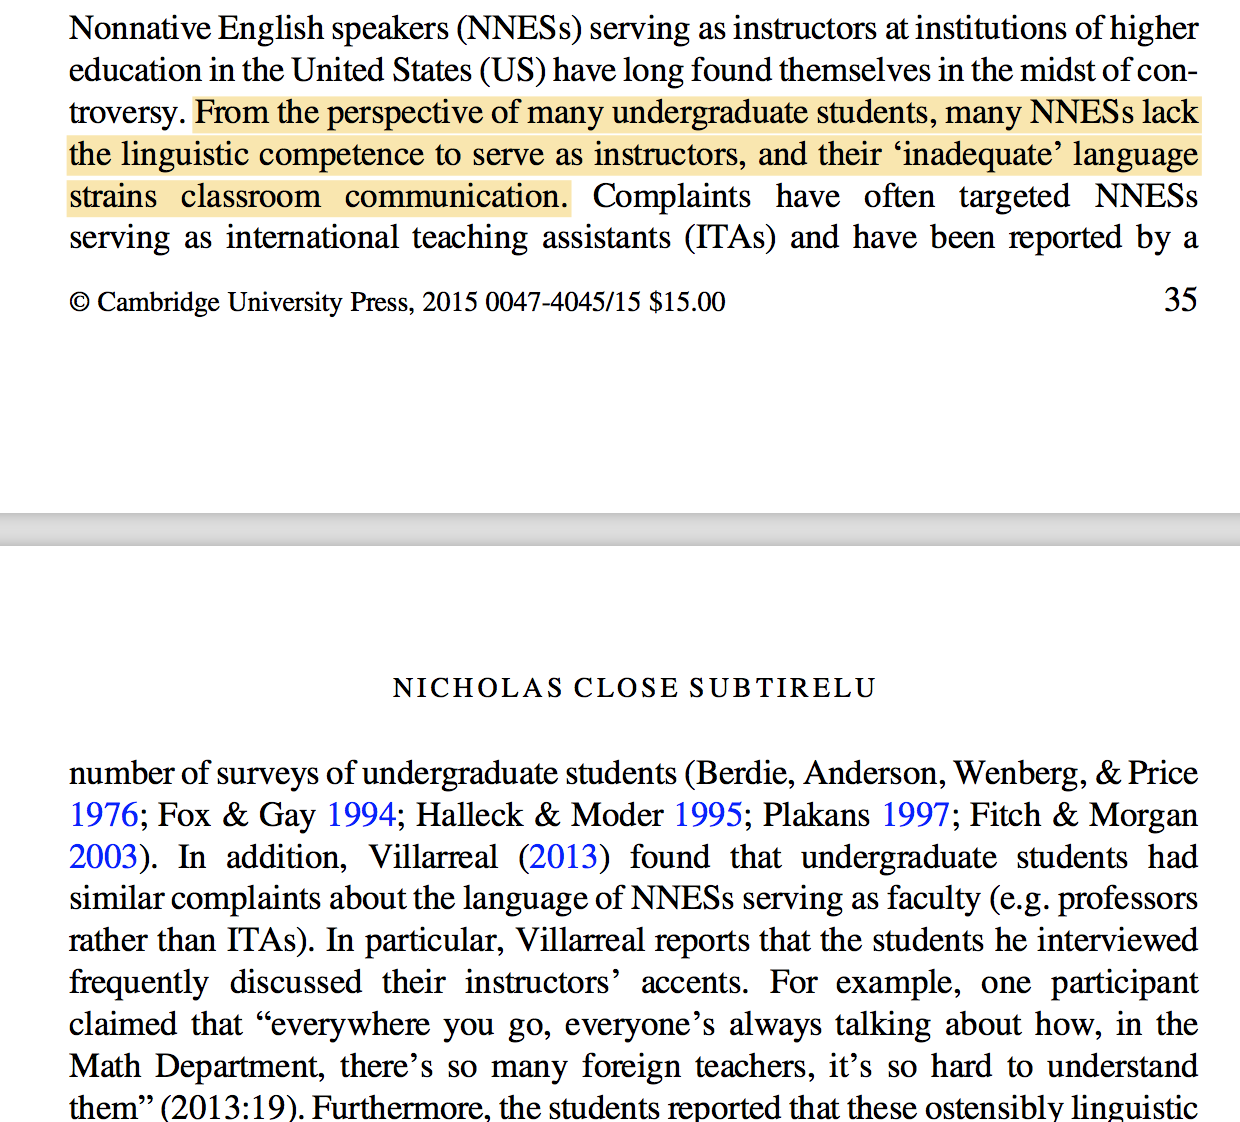 --- 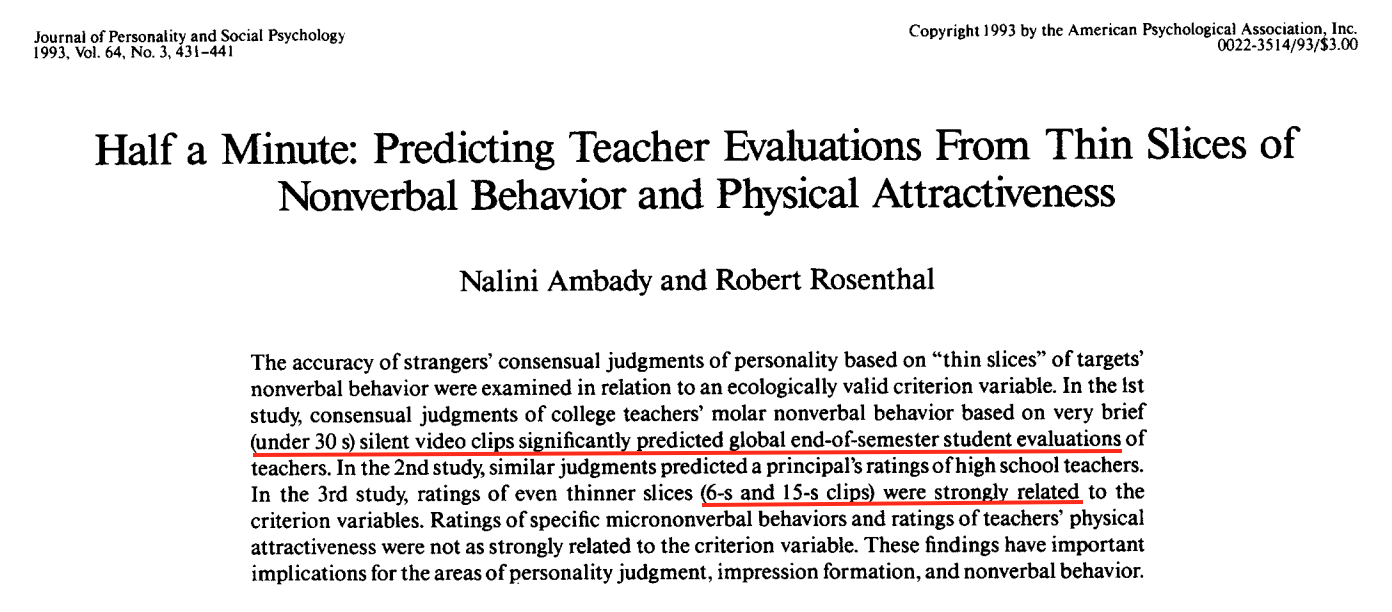 --- 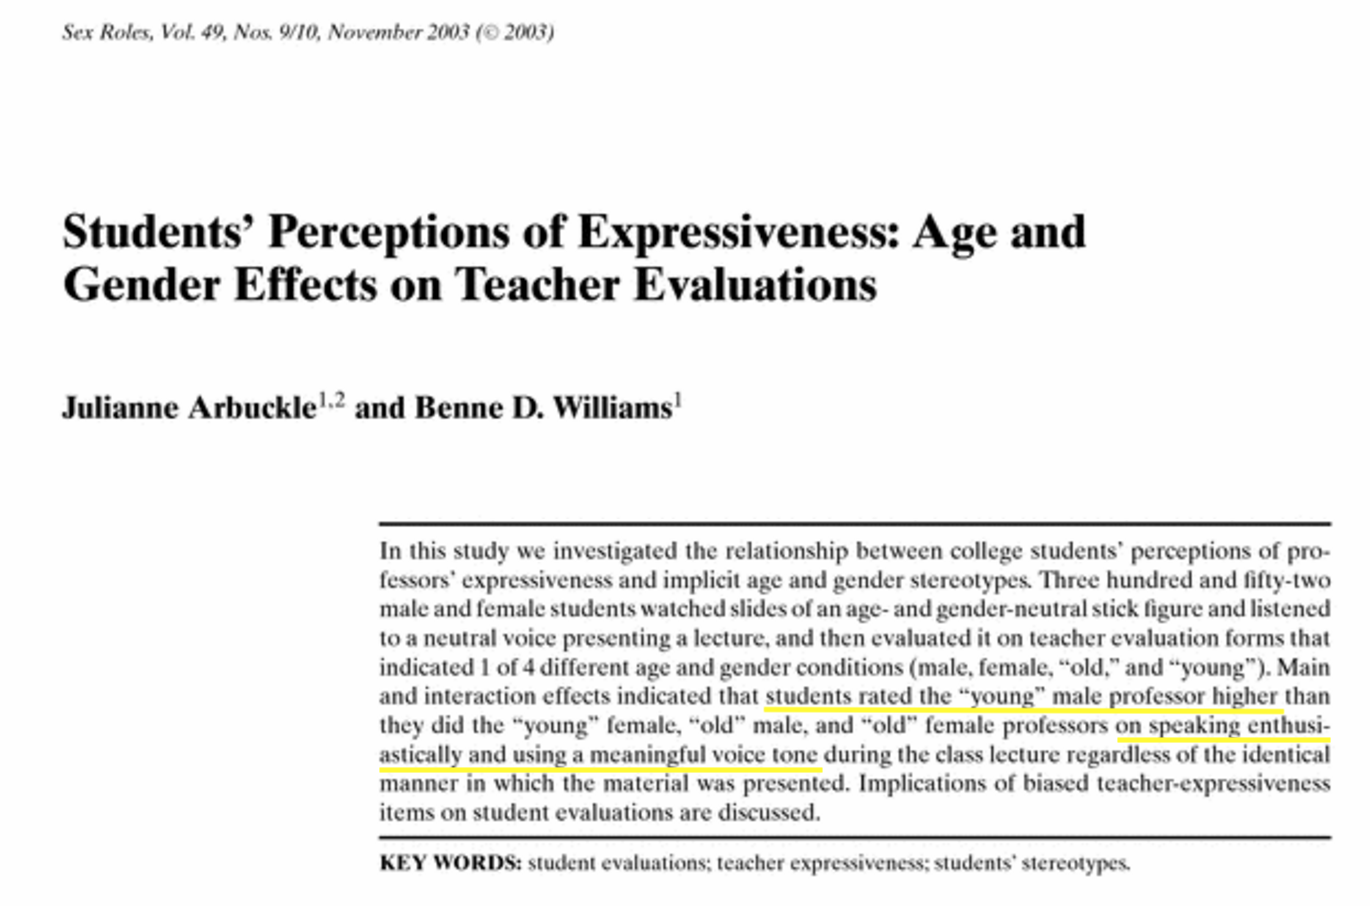 --- 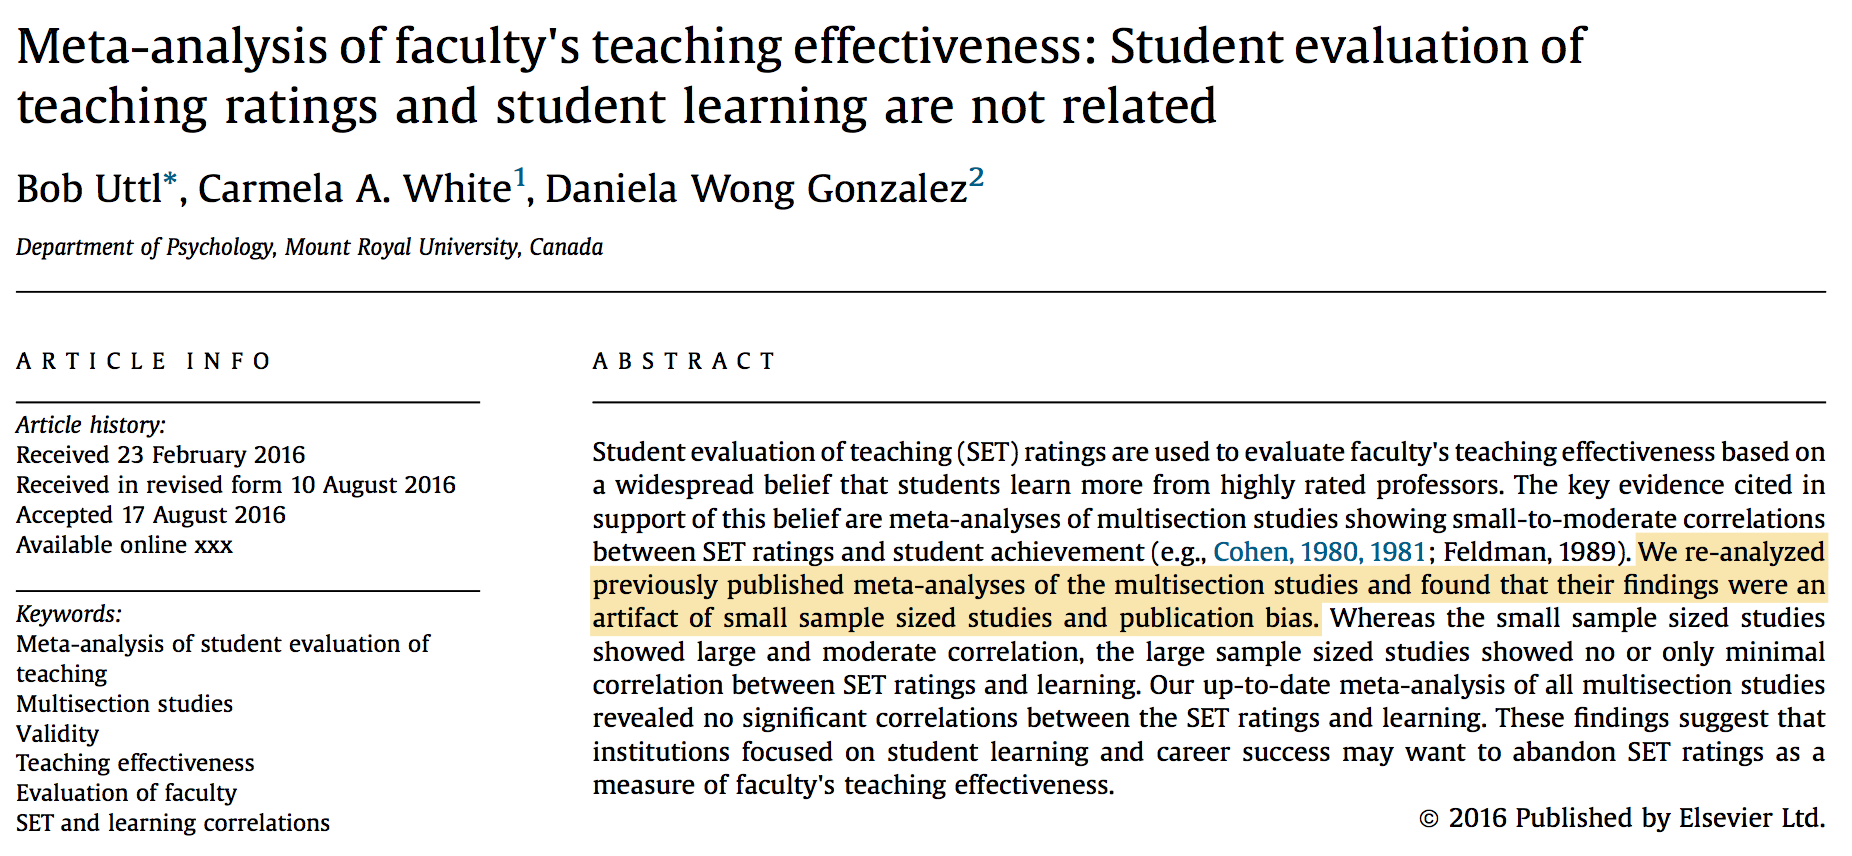 --- 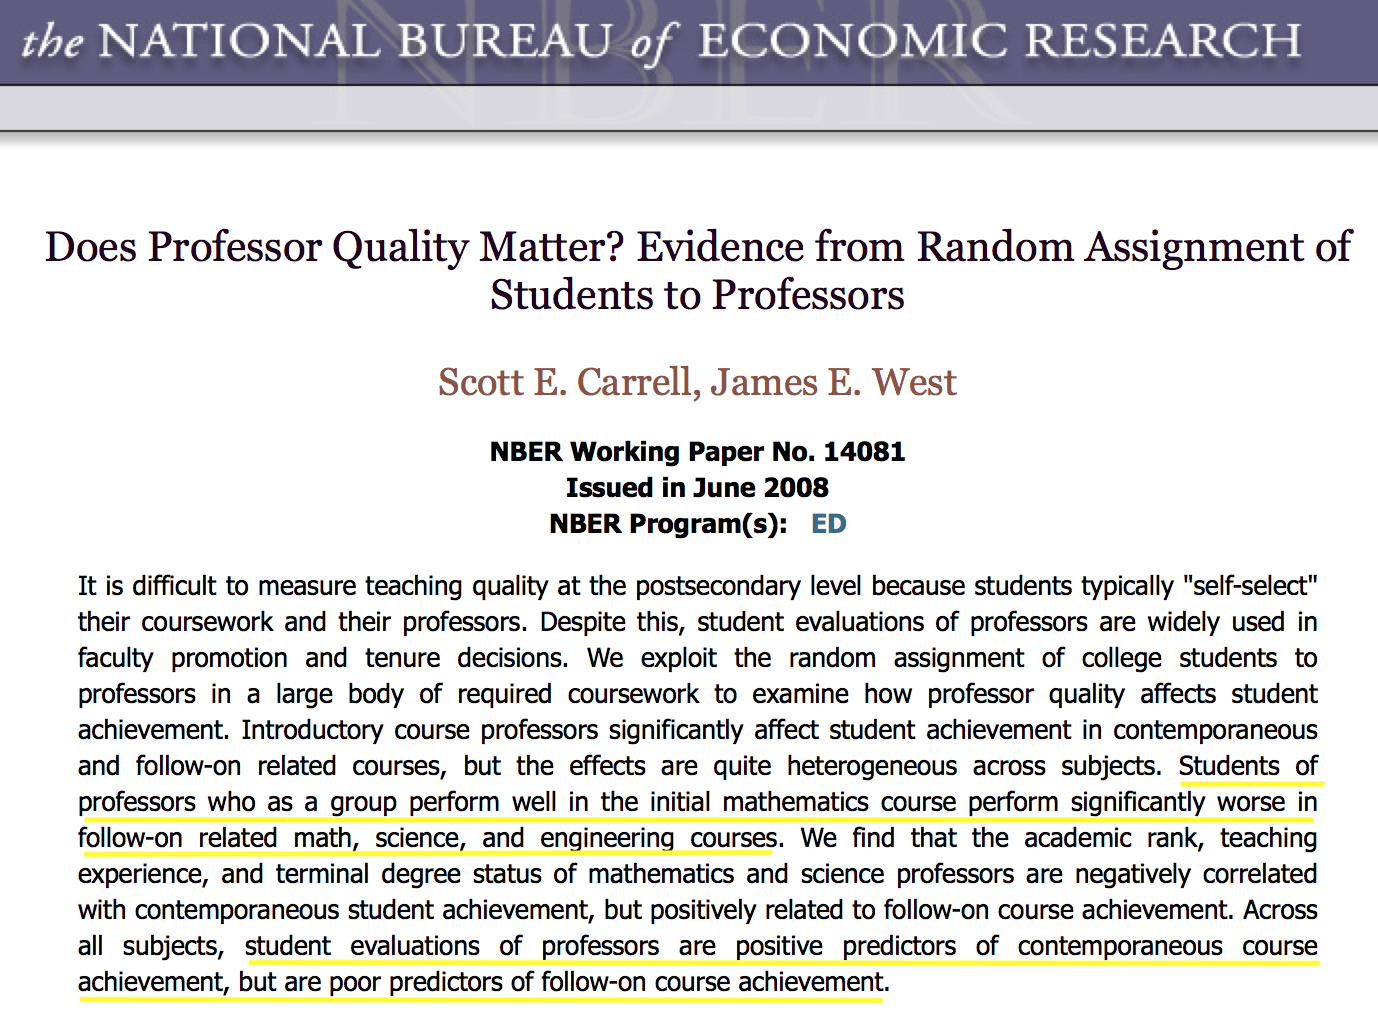 ---  --- 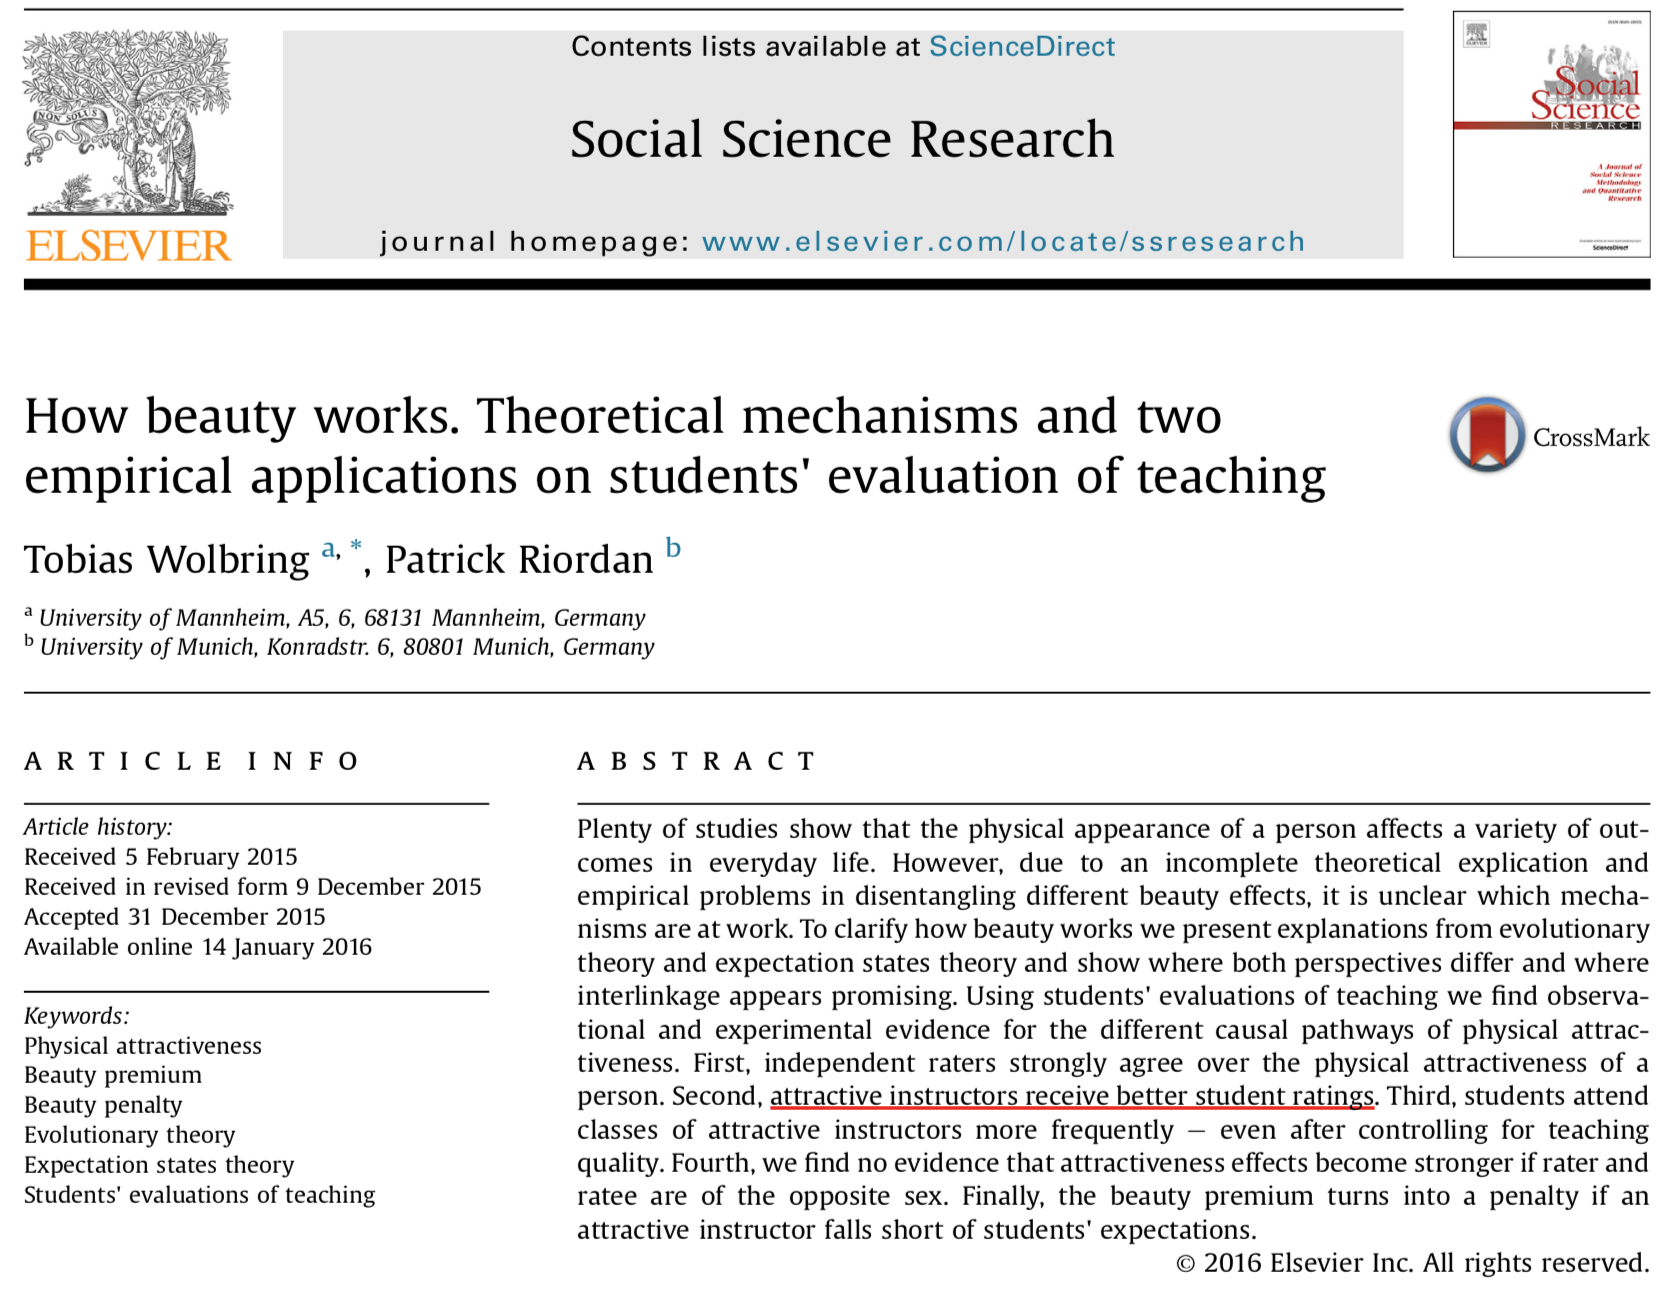 --- <img src="./SetPics/keng17.png" height="600px" alt="Keng 2017" /> --- 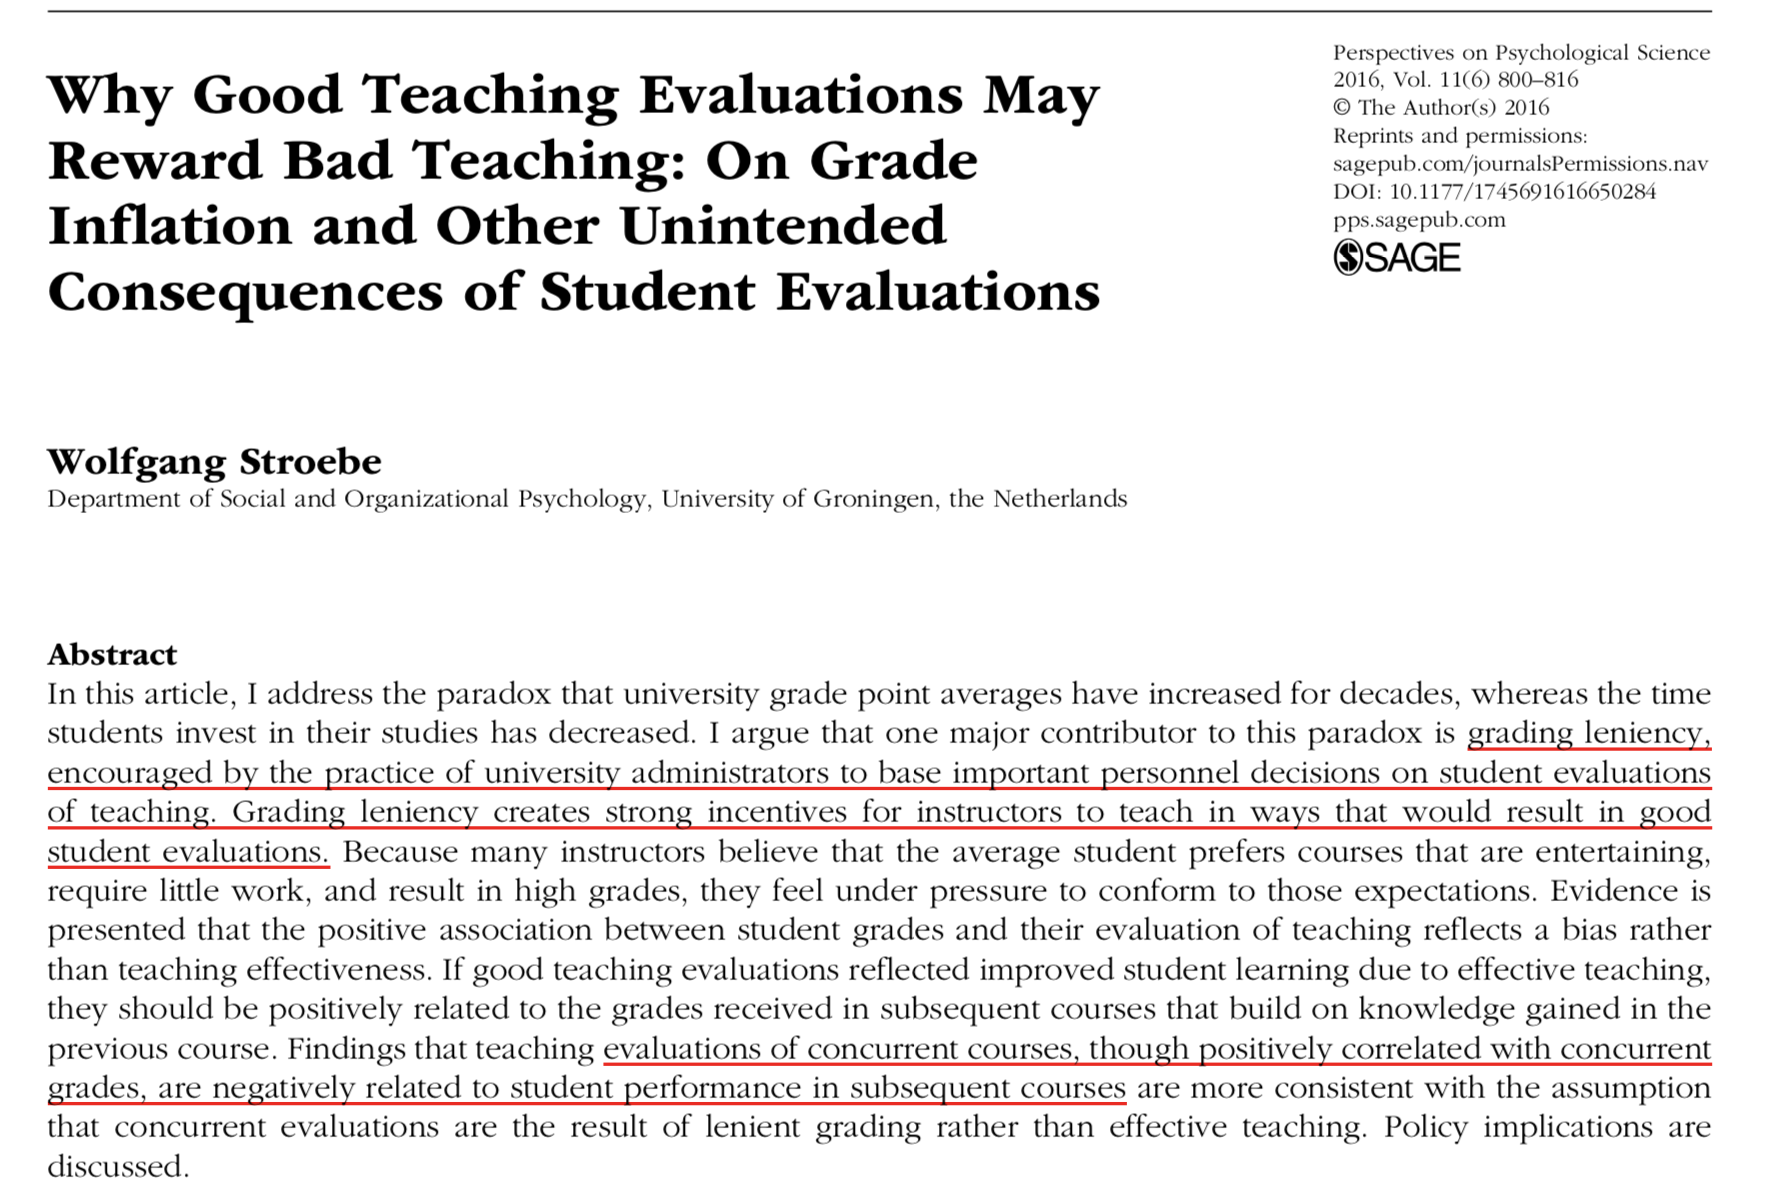 --- Wagner et al., 2016 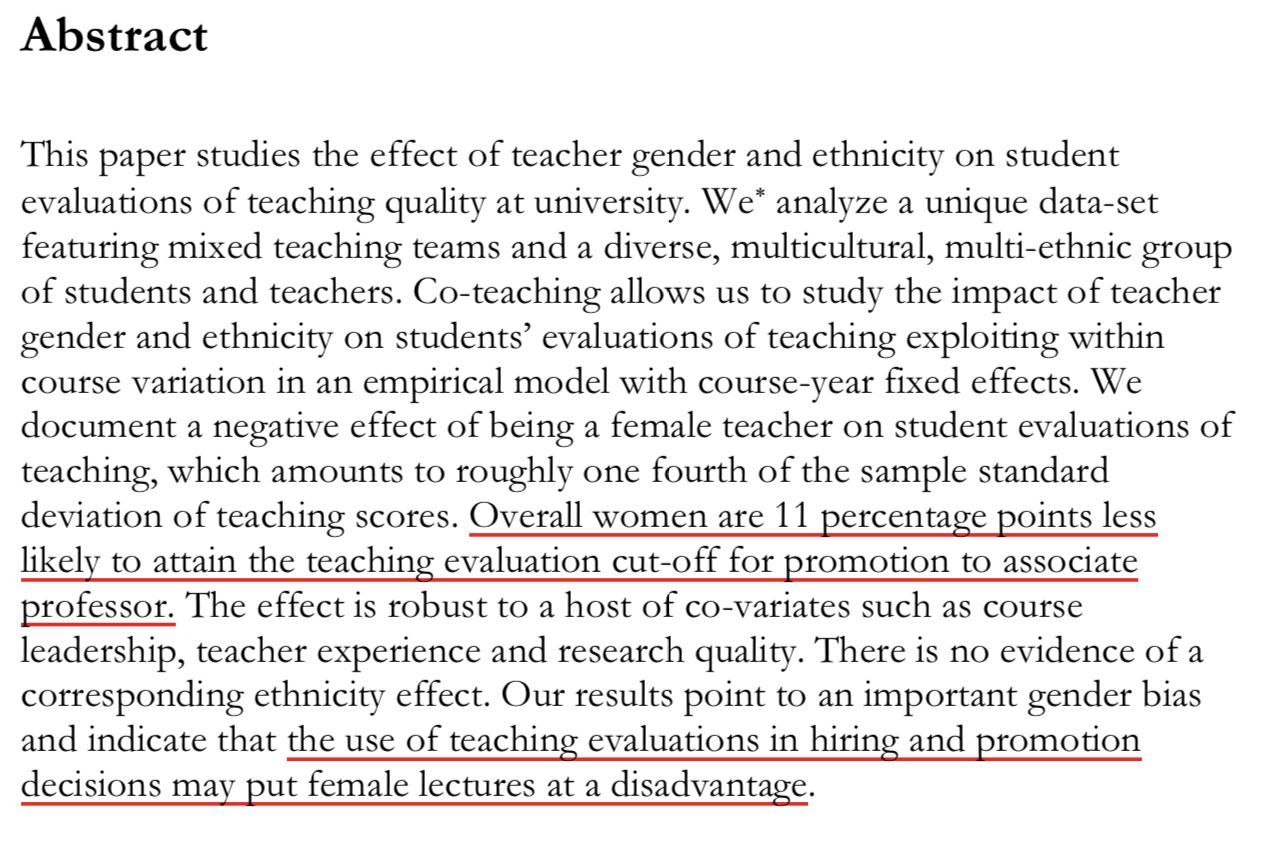 --- .center.vcenter.large[Part III: Deeper Dive] --- <img src="./SetPics/macnellEtal15.png" height="600px" /> --- .left-column[ [MacNell, Driscoll, & Hunt, 2014](http://link.springer.com/article/10.1007/s10755-014-9313-4) NC State online course. Students randomized into 6 groups, 2 taught by primary prof, 4 by GSIs. 2 GSIs: 1 male 1 female. GSIs used actual names in 1 section, swapped names in 1 section. 5-point scale. ] .right-column[ .small[ <table> <tr><th> Characteristic</th> <th>M - F</th> <th>perm \(P\)</th> <th>t-test \(P\)</th></tr> <tr><td>Overall </td><td> 0.47 </td><td> 0.12 </td><td> 0.128 </td></tr> <tr><td>Professional </td><td> 0.61 </td><td> 0.07 </td><td> 0.124 </td></tr> <tr><td>Respectful </td><td> 0.61 </td><td> 0.06 </td><td> 0.124 </td></tr> <tr><td>Caring </td><td> 0.52 </td><td> 0.10 </td><td> 0.071 </td></tr> <tr><td>Enthusiastic </td><td> 0.57 </td><td> 0.06 </td><td> 0.112 </td></tr> <tr><td>Communicate </td><td> 0.57 </td><td> 0.07 </td><td> NA </td></tr> <tr><td>Helpful </td><td> 0.46 </td><td> 0.17 </td><td> 0.049 </td></tr> <tr><td>Feedback </td><td> 0.47 </td><td> 0.16 </td><td> 0.054 </td></tr> <tr><td>Prompt </td><td> 0.80 </td><td style="background-color:yellow"> 0.01 </td><td> 0.191 </td></tr> <tr><td>Consistent </td><td> 0.46 </td><td> 0.21 </td><td> 0.045 </td></tr> <tr><td>Fair </td><td> 0.76 </td><td style="background-color:yellow"> 0.01 </td><td> 0.188 </td></tr> <tr><td>Responsive </td><td> 0.22 </td><td> 0.48 </td><td> 0.013 </td></tr> <tr><td>Praise </td><td> 0.67 </td><td style="background-color:yellow"> 0.01 </td><td> 0.153 </td></tr> <tr><td>Knowledge </td><td> 0.35 </td><td> 0.29 </td><td> 0.038 </td></tr> <tr><td>Clear </td><td> 0.41 </td><td> 0.29 </td><td> NA </td></tr> </table> ] ] --- ### Exam performance and instructor gender Mean grade and instructor gender (male minus female) <table> <tr><th> </th><th> difference in means </th><th> \(P\)-value </th></tr> <tr><td> Perceived </td><td> 1.76 </td><td> 0.54 </td></tr> <tr><td> Actual </td><td> -6.81 </td><td style="background-color:yellow"> 0.02 </td></tr> </table> Permutation tests based on the randomization, Neyman model, conditioning on students assigned to each actual instructor, nonresponders are unconditional --- ### "Natural experiment": Boring et al., 2016. + 5 years of data for 6 mandatory freshman classes at SciencesPo:<br />History, Political Institutions, Microeconomics, Macroeconomics, Political Science, Sociology -- + 23,001 SET, 379 instructors, 4,423 students, 1,194 sections (950 without PI), 21 year-by-course strata -- + response rate ~100% + anonymous finals except PI + interim grades before final -- #### Test statistics (for stratified permutation test) + Correlation between SET and gender within each stratum, averaged across strata + Correlation between SET and average final exam score within each stratum, averaged across strata --- ### SciencesPo Average correlation between SET and final exam score <table> <tr><th> </th><th> strata </th><th> \(\bar{\rho}\) </th><th> \(P\) </th></tr> <tr><td>Overall </td><td> 26 (21) </td><td> 0.04 </td><td> 0.09 </td></tr> <tr><td>History </td><td> 5 </td><td> 0.16 </td><td style="background-color:yellow"> 0.01 </td></tr> <tr><td>Political Institutions </td><td> 5 </td><td> N/A </td><td> N/A </td></tr> <tr><td>Macroeconomics </td><td> 5 </td><td> 0.06 </td><td> 0.19 </td></tr> <tr><td>Microeconomics </td><td> 5 </td><td> -0.01 </td><td> 0.55 </td></tr> <tr><td>Political science </td><td> 3 </td><td> -0.03 </td><td> 0.62 </td></tr> <tr><td>Sociology </td><td> 3 </td><td> -0.02 </td><td> 0.61 </td></tr> </table> --- Average correlation between SET and instructor gender <table> <tr><th> </th><th> \(\bar{\rho}\) </th><th> \(P\) </th></tr> <tr><td>Overall </td><td> 0.09 </td><td style="background-color:yellow"> 0.00 </td></tr> <tr><td>History </td><td> 0.11 </td><td> 0.08 </td></tr> <tr><td>Political institutions </td><td> 0.11 </td><td> 0.10 </td></tr> <tr><td>Macroeconomics </td><td> 0.10 </td><td> 0.16 </td></tr> <tr><td>Microeconomics </td><td> 0.09 </td><td> 0.16 </td></tr> <tr><td>Political science </td><td> 0.04 </td><td> 0.63 </td></tr> <tr><td>Sociology </td><td> 0.08 </td><td> 0.34 </td></tr> </table> --- Average correlation between final exam scores and instructor gender <table> <tr><th> </th><th> \(\bar{\rho}\) </th><th> \(P\) </th></tr> <tr><td>Overall </td><td> -0.06 </td><td> 0.07 </td></tr> <tr><td>History </td><td> -0.08 </td><td> 0.22 </td></tr> <tr><td>Macroeconomics </td><td> -0.06 </td><td> 0.37 </td></tr> <tr><td>Microeconomics </td><td> -0.06 </td><td> 0.37 </td></tr> <tr><td>Political science </td><td> -0.03 </td><td> 0.70 </td></tr> <tr><td>Sociology </td><td> -0.05 </td><td> 0.55 </td></tr> </table> --- Average correlation between SET and interim grades <table> <tr><th> </th><th> \(\bar{\rho}\) </th><th> \(P\) </th></tr> <tr><td>Overall </td><td> 0.16 </td><td style="background-color:yellow"> 0.00 </td></tr> <tr><td>History </td><td> 0.32 </td><td style="background-color:yellow"> 0.00 </td></tr> <tr><td>Political institutions </td><td> -0.02 </td><td> 0.61 </td></tr> <tr><td>Macroeconomics </td><td> 0.15 </td><td style="background-color:yellow"> 0.01 </td></tr> <tr><td>Microeconomics </td><td> 0.13 </td><td style="background-color:yellow"> 0.03 </td></tr> <tr><td>Political science </td><td> 0.17 </td><td style="background-color:yellow"> 0.02 </td></tr> <tr><td>Sociology </td><td> 0.24 </td><td style="background-color:yellow"> 0.00 </td></tr> </table> --- ### Main conclusions; multiplicity 1. lack of association between SET and final exam scores (negative result, so multiplicity not an issue) 1. lack of association between instructor gender and final exam scores (negative result, so multiplicity not an issue) 1. association between SET and instructor gender 1. association between SET and interim grades Bonferroni's adjustment for four tests leaves the associations highly significant: adjusted \\(P < 0.01\\). --- ### What are we measuring? US data: controls for _everything_ but the name, since compares each TA to him/herself. French data: controls for subject, year, teaching effectiveness --- .center.vcenter.large[Part IV: Is there real controversy?] --- ### Who supports SET? .framed[ .blue[ >> It is difficult to get a man to understand something, when his salary depends upon his not understanding it! —Upton Sinclair ] ] --- ### Benton & Cashin, 2012: exemplar SET apologists + Widely cited, but it's a technical report from IDEA, a business that sells SET. -- + Claims SET are reliable and valid. -- + Does not cite Carrell & West (2008) or Braga et al. (2011), randomized experiments published before B&C (2012) -- + As far as I can tell, no study B&C cite in support of validity used randomization. --- ### Benton & Cashin on validity >> Theoretically, the best indicant of effective teaching is student learning. Other things being equal, the students of more effective teachers should learn more. -- I agree. --- #### Straw-man hypothesis: - Who claims SET have **absolutely no connection** to teaching effectiveness? -- - .red[question is not whether there's _any_ association between SET and effectiveness.] -- - .blue[question is _how well_ SET measure effectiveness, and whether factors unrelated to effectiveness are confounded enough that SET is misleading or discriminatory] --- ## Better questions: + Are SET more sensitive to effectiveness or to something else? + Do comparably effective women and men get comparable SET? + But for their gender, would women get higher SET than they do? (And but for their gender, would men get lower SET than they do?) -- .blue[Need to compare like teaching with like teaching, not an arbitrary collection of women with an arbitrary collection of men.] -- Boring (2014) finds _costs_ of increasing SET very different for men and women. --- ### Example fallacy: [Wallisch & Cachia, 2018](https://slate.com/technology/2018/04/hotness-affects-student-evaluations-more-than-gender.html) 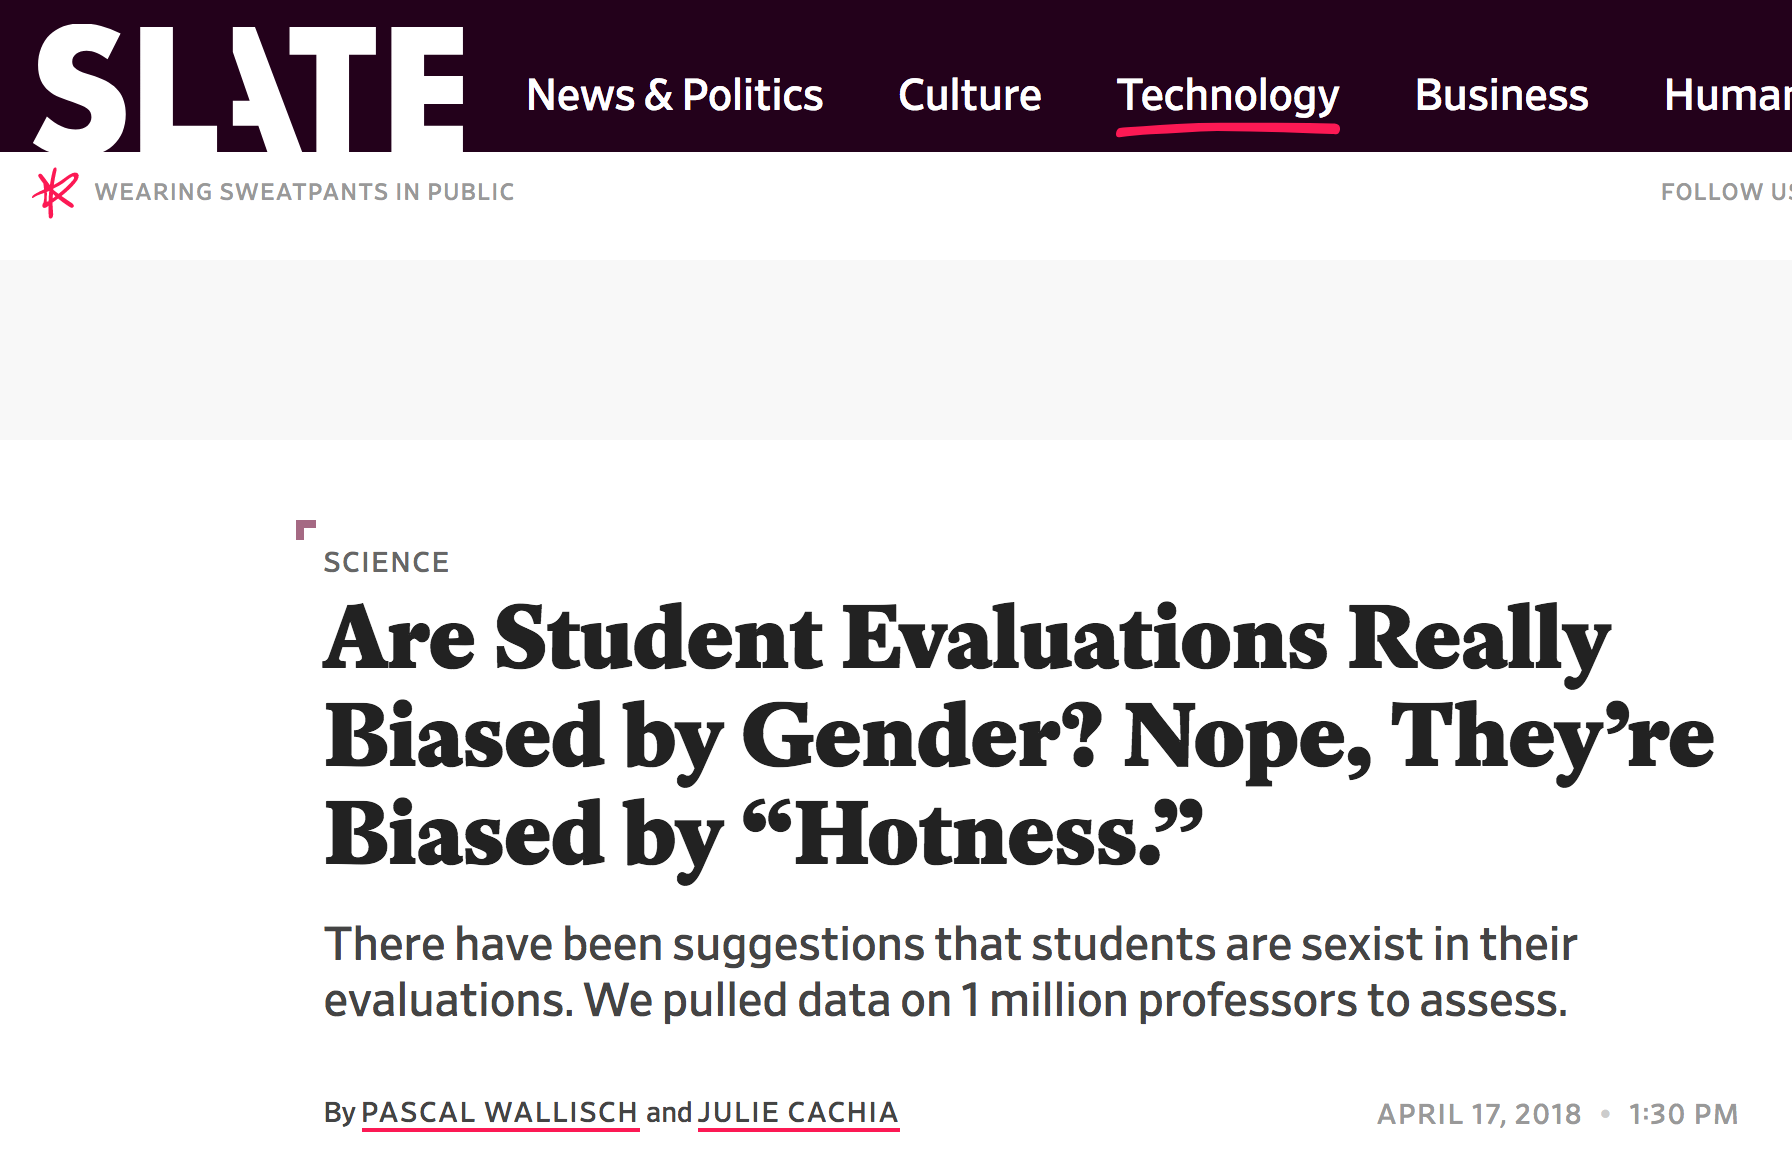 --- ## These are not the only biases! + Ethnicity and race + Age + Attractiveness + Accents / non-native English speakers … --- ## What do SET measure? - .blue[strongly correlated with students' grade expectations]<br /> Boring et al., 2016; Johnson, 2003; Marsh & Cooper, 1980; Short et al., 2008; Worthington, 2002 -- - .blue[strongly correlated with enjoyment] Stark, unpublished, 2012. 1486 students<br /> Correlation btw instructor effectiveness & enjoyment: 0.75.<br /> Correlation btw course effectiveness & enjoyment: 0.8. -- - .blue[correlated with instructor gender, ethnicity, attractiveness, & age]<br /> Anderson & Miller, 1997; Ambady & Rosenthal, 1993; Arbuckle & Williams, 2003; Basow, 1995; Boring, 2014; Boring et al., 2016; Cramer & Alexitch, 2000; Marsh & Dunkin, 1992; MacNell et al., 2014; Wachtel, 1998; Wallish & Cachia, 2018; Weinberg et al., 2007; Worthington, 2002 -- - .blue[omnibus, abstract questions about curriculum design, effectiveness, etc., most influenced by factors unrelated to learning]<br /> Worthington, 2002 -- - .red[SET are not very sensitive to effectiveness; weak and/or negative association] -- - .red[Calling something "teaching effectiveness" does not make it so] -- - .red[Computing averages to 2 decimals doesn't make them reliable] --- .center.vcenter.large[Part V: What to do, then?] --- ### What might we be able to discover about teaching? .looser[ + Is she dedicated to and engaged in her teaching? + Is she available to students? + Is she putting in appropriate effort? Is she creating new materials, new courses, or new pedagogical approaches? + Is she revising, refreshing, and reworking existing courses using feedback and on-going experiment? + Is she helping keep the department's curriculum up to date? + Is she trying to improve? + Is she contributing to the college's teaching mission in a serious way? + Is she supervising undergraduates for research, internships, and honors theses? + Is she advising and mentoring students? + Do her students do well when they graduate? ] --- ## Principles for SET items + students' subjective experience of the course (e.g., did the student find the course challenging?) + personal observations (e.g., was the instructor’s handwriting legible?) + avoid abstract questions, omnibus questions, and questions requiring judgment, because they are particularly subject to biases related to instructor gender, age, and other characteristics protected by employment law + avoid questions that require evaluative judgments (e.g., how effective was the instructor?) + focus on things that affect learning and the learning experience + multiple-choice items generally should provide free-form space to explain choice + still, interpret the results cautiously --- ## Better SET items (but too many!) + I understood what was expected of me + I attended scheduled classes + Lectures helped me to understand the substance + I read the assigned textbook, lecture notes, or other materials + When did you do the readings? + The textbook, lecture notes or other course materials helped me understand the course substance. + I completed the assignments. + The assignments helped me understand the course substance. + I could understand what was being asked of me in assessments and assignments. + I attended office hours. --- + I found feedback (in class, on assignments, exams, term papers, presentations, etc.) useful to understand how to improve. + What materials or activities did you find most useful? [lectures, recorded lectures, readings, assignments, ...] + I felt there were ways to get help, even if I did not take advantage of them. + I felt adequately prepared for the course. + If you did not feel prepared, had you taken the prerequisites listed for the course? + I felt that active participation in class was welcomed or encouraged by the instructor. + I could hear and/or understand the instructor in class. + I could read the instructor’s handwriting and/or slides. + Did physical aspects of the classroom (boards, lighting, projectors, sound system, seating) impede your ability to learn or participate? (Yes, no) --- + Compared to other courses at this level, I found this course … (more difficult, about the same, easier) + Compared to other courses with the same number of units, I found this course ... (more work, about the same, less work) + I enjoyed this course. + I found this course to be valuable or worthwhile. + What grade do you expect to get in the course, based on the work you have done so far? + What grade do you feel you deserve to get in the course, based on the work you have done so far? + Are you satisfied with the effort you put into this course? + Was this course in your (intended) major? + If this course was an elective outside your (intended) major, do you plan to take a sequel course in the discipline? + What would you have liked to have more of in the course? + What would you have liked to have less of in the course? --- #### What's happening at UC Berkeley? + Peer observation in my department and some others + Teaching portfolios recommended by senate & MPS division + De-emphasizing SET in MPS division, "blessed" by senate & admin + Revising SET items to avoid calling for judgments --- #### Litigation + Union arbitration in Newfoundland (Memorial U.) + Union arbitration in Ontario (OCUFA, Ryerson U.) + Civil litigation in Ohio (Miami U.) + Civil litigation in Vermont + Union arbitration in Florida (UFF, U. Florida) + Union grievance in California (Berkeley) + Discussions with several attorneys who want to pursue class actions --- #### References + Ambady, N., and R. Rosenthal, 1993. Half a Minute: Predicting Teacher Evaluations from Thin Slices of Nonverbal Behavior and Physical Attractiveness, _J. Personality and Social Psychology_, _64_, 431-441. + Arbuckle, J. and B.D. Williams, 2003. Students' Perceptions of Expressiveness: Age and Gender Effects on Teacher Evaluations, _Sex Roles_, _49_, 507-516. DOI 10.1023/A:1025832707002 + Archibeque, O., 2014. Bias in Student Evaluations of Minority Faculty: A Selected Bibliography of Recent Publications, 2005 to Present. http://library.auraria.edu/content/bias-student-evaluations-minority-faculty (last retrieved 30 September 2016) + Basow, S., S. Codos, and J. Martin, 2013. The Effects of Professors' Race and Gender on Student Evaluations and Performance, _College Student Journal_, _47_ (2), 352-363. + Blair-Loy, M., E. Rogers, D. Glaser, Y.L.A. Wong, D. Abraham, and P.C. Cosman, 2017. Gender in Engineering Departments: Are There Gender Differences in Interruptions of Academic Job Talks?, _Social Sciences_, _6_, doi:10.3390/socsci6010029 + Boring, A., 2015. Gender Bias in Student Evaluations of Teachers, OFCE-PRESAGE-Sciences-Po Working Paper, http://www.ofce.sciences-po.fr/pdf/dtravail/WP2015-13.pdf (last retrieved 30 September 2016) + Boring, A., K. Ottoboni, and P.B. Stark, 2016. Student Evaluations of Teaching (Mostly) Do Not Measure Teaching Effectiveness, _ScienceOpen_, DOI 10.14293/S2199-1006.1.SOR-EDU.AETBZC.v1 --- + Braga, M., M. Paccagnella, and M. Pellizzari, 2014. Evaluating Students' Evaluations of Professors, _Economics of Education Review_, _41_, 71-88. + Carrell, S.E., and J.E. West, 2010. Does Professor Quality Matter? Evidence from Random Assignment of Students to Professors, _J. Political Economy_, _118_, 409-432. + Johnson, V.E., 2003. Grade Inflation: A Crisis in College Education, Springer-Verlag, NY, 262pp. + Kaatz, A., B. Gutierrez, and M. Carnes, 2014. Threats to objectivity in peer review: the case of gender, _Trends in Pharmacological Science_, _35_, 371–373. doi:10.1016/j.tips.2014.06.005 + Keng, S.-H., 2017. Tenure system and its impact on grading leniency, teaching effectiveness and student effort, _Empirical Economics_, DOI 10.1007/s00181-017-1313-7 + Lauer, C., 2012. A Comparison of Faculty and Student Perspectives on Course Evaluation Terminology, in _To Improve the Academy: Resources for Faculty, Instructional, and Educational Development_, _31_, J.E. Groccia and L. Cruz, eds., Jossey-Bass, 195-211. + MacNell, L., A. Driscoll, and A.N. Hunt, 2015. What's in a Name: Exposing Gender Bias in Student Ratings of Teaching, _Innovative Higher Education_, _40_, 291-303. DOI 10.1007/s10755-014-9313-4 --- + Madera, J.M., M.R. Hebl, and R.C. Martin, 2009. Gender and Letters of Recommendation for Academia: Agentic and Communal Differences, _Journal of Applied Psychology_, _94_, 1591–1599 DOI: 10.1037/a0016539 + Moss-Racusin, C.A., J.F. Dovidio, V.L. Brescoll, M.J. Graham, and J. Handelsman, 2012. Science faculty's subtle gender biases favor male students, _PNAS_, _109_, 16474–16479. www.pnas.org/cgi/doi/10.1073/pnas.1211286109 + Reuben, E., P. Sapienza, and L. Zingales, 2014. How stereotypes impair women’s careers in science, _PNAS_, _111_, 4403–4408. www.pnas.org/cgi/doi/10.1073/pnas.1314788111 + Schmader, T., J. Whitehead, and V.H. Wysocki, 2007. A Linguistic Comparison of Letters of Recommendation for Male and Female Chemistry and Biochemistry Job Applicants, _Sex Roles_, _57_, 509–514. doi:10.1007/s11199-007-9291-4 + Short, H., Boyle, R., Braithwaite, R., Brookes, M., Mustard, J., & Saundage, D. (2008, July). A comparison of student evaluation of teaching with student performance. In OZCOTS 2008: Proceedings of the 6th Australian Conference on Teaching Statistics (pp. 1-10). OZCOTS + Sarsons, 2015. http://scholar.harvard.edu/files/sarsons/files/gender_groupwork.pdf?m=1449178759 + Schmidt, B., 2015. Gendered Language in Teacher Reviews, http://benschmidt.org/profGender (last retrieved 30 September 2016) --- + Stark, P.B., and R. Freishtat, 2014. An Evaluation of Course Evaluations, _ScienceOpen_, DOI 10.14293/S2199-1006.1.SOR-EDU.AOFRQA.v1 + Stroebe, W., 2016. Why Good Teaching Evaluations May Reward Bad Teaching: On Grade Inflation and Other Unintended Consequences of Student Evaluations, _Perspectives on Psychological Science_, _11_ (6) 800–816, DOI: 10.1177/1745691616650284 + Subtirelu, N.C., 2015. "She does have an accent but…": Race and language ideology in students' evaluations of mathematics instructors on RateMyProfessors.com, _Language in Society_, _44_, 35-62. DOI 10.1017/S0047404514000736 + Uttl, B., C.A. White, and A. Morin, 2013. The Numbers Tell it All: Students Don't Like Numbers!, _PLoS ONE_, _8_ (12): e83443, DOI 10.1371/journal.pone.0083443 + Uttl, B., C.A. White, and D.W. Gonzalez, 2016. Meta-analysis of Faculty's Teaching Effectiveness: Student Evaluation of Teaching Ratings and Student Learning Are Not Related, _Studies in Educational Evaluation_, DOI: 0.1016/j.stueduc.2016.08.007 + Wagner, N., M. Rieger, and K. Voorvelt, 2016. International Institute of Social Studies Working Paper 617. + Wallish, P. and J. Cachia, 2018. Are student evaluations really biased by gender? Nope, they're biased by "hotness." _Slate_, slate.com/technology/2018/04/hotness-affects-student-evaluations-more-than-gender.html --- + Witteman, H., M. Hendricks, S. Straus, and C. Tannenbaum, 2018. Female grant applicants are equally successful when peer reviewers assess the science, but not when they assess the scientist. https://www.biorxiv.org/content/early/2018/01/19/232868 + Wolbring, T. and P. Riordan, 2016. How beauty works. Theoretical mechanisms and two empirical applications on students' evaluation of teaching, _Social Science Research_, _57_, 253–272