class: blueBack ## Teaching Evaluations (Mostly) Do Not Measure Teaching Effectiveness ### CSU Ethics Colloquium Series<br />Vice President for Research<br />Colorado State University <br />Fort Collins, CO<br />3 October 2016 #### Philip B. Stark<br /> Department of Statistics <br /> University of California, Berkeley<br />http://www.stat.berkeley.edu/~stark | [@philipbstark](https://twitter.com/philipbstark) #### Joint work with Anne Boring, Richard Freishtat, Kellie Ottoboni --- <br /> <br /> .center.large.blue.vcenter[***The truth will set you free, but first it will piss you off.***] .align-right.medium[—Gloria Steinem] --- ### Student Evaluations of Teaching (SET) + most common method to evaluate teaching + used for hiring, firing, tenure, promotion + simple, cheap, fast to administer --- ### Typical SET items: -- - Considering the limitations & possibilities of the subject matter & the course, how would you rate the overall effectiveness of this instructor? -- - Considering the limitations & possibilities of the subject matter, how effective was the course? -- - presentation, explanations, availability, feedback, organization, development of skills & critical thinking, time/effort spent -- ≈40% of students report spending >20 h/w on every course --- .center.vcenter.large[Part I: Basic Statistics] --- ### Nonresponse -- + SET surveys are an incomplete census, not a random sample. -- + Suppose 70% of students respond, with an average of 4 on a 7-point scale. -- .red[Then the class average could be anywhere between 3.1 & 4.9] -- + "Margin of error" meaningless: not a random sample -- .center[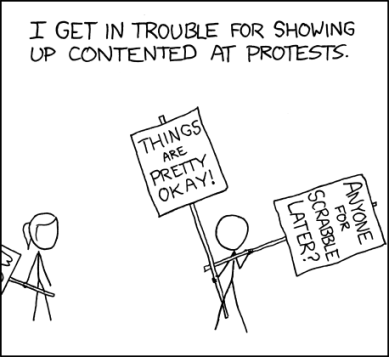] https://xkcd.com/470/ --- ### All our arithmetic is below average + Does a 3 mean the same thing to every student—even approximately? -- + Is a 5 in an upper-division architecture studio the same as a 5 in a required freshman Econ course with 500 students? -- + Is the difference between 1 & 2 the same as the difference between 5 & 6? -- + Does a 1 balance a 7 to make two 4s? -- + Averages throw away important information about variability: - (1+1+7+7)/4 = (2+3+5+6)/4 = (1+5+5+5)/4 = (4+4+4+4)/4 = 4 - Polarizing teacher ≠ teacher w/ mediocre ratings - 3 statisticians go deer hunting … --- ### What does the mean mean? .blue[Averages makes sense for interval scales, not ordinal scales like SET.] -- .red[Averaging SET doesn't make sense.] -- Doesn't make sense to compare average SET across: + courses + instructors + levels + types of classes + modes of instruction + disciplines -- Shouldn't ignore variability or nonresponse. -- .blue[But reporting averages is seductive: <em>quantifauxcation</em>.] --- .center.vcenter.large[Part II: Science, Sciencism] ---  > If you can't prove what you want to prove, demonstrate something else and pretend they are the same thing. In the daze that follows the collision of statistics with the human mind, hardly anyone will notice the difference. .align-right[Darrell Huff] --- ## What's effective teaching? -- + Should facilitate learning -- + Grades usually not a good proxy for learning -- + Students generally can't judge how much they learned -- + Serious problems with confounding -- 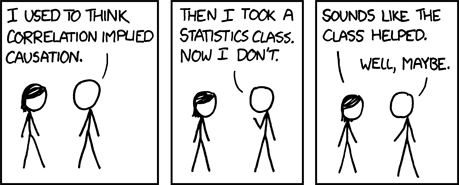 https://xkcd.com/552/ --- ### Lauer, 2012. Not just the numbers Survey of 185 students, 45 faculty at Rollins College, Winter Park, Florida > .blue[I once believed that narrative comments on course evaluation forms were straightforward and useful.] -- Faculty & students use the same vocabulary quite differently, ascribing quite different meanings to words such as "fair," "professional," "organized," "challenging," & "respectful." -- <table> <tr><th> <em>not fair</em> means …</th><th>student %</th><th>instructor %</th></tr> <tr><td>plays favorites</td> <td>45.8</td> <td>31.7</td></tr> <tr><td>grading problematic</td> <td>2.3 </td> <td>49.2</td></tr> <tr><td>work is too hard</td> <td>12.7</td> <td>0</td></tr> <tr><td>won't "work with you" on problems</td> <td>12.3</td> <td>0</td></tr> <tr><td>other</td> <td>6.9</td> <td>19</td></tr> </table> --- .large.blue.center.vcenter[Do SET measure teaching effectiveness?] ### Dr. Fox lecture <iframe width="420" height="315" src="https://www.youtube.com/embed/RcxW6nrWwtc" frameborder="0" allowfullscreen></iframe> --- ## Reliability - Do different students rate the same instructor similarly? - Would a student rate the same instructor consistently later? -- Unrelated to effectiveness. -- 100 scales might all report your weight to be exactly the same. -- .blue[Doesn't mean they measured your _height_ accurately.] -- .blue[(Or your weight.)] -- ## Validity Do SET primarily measure teaching effectiveness? -- Bias from gender, attractiveness, ethnicity, accent, math content, rigor, time of day, class size? --- ## Truthful or Truthy? [Truthiness (Colbert Report: The Word)](http://thecolbertreport.cc.com/videos/63ite2/the-word---truthiness) <div style="background-color:#000000;width:650px;"> <div style="padding:4px;"> <iframe src="http://media.mtvnservices.com/embed/mgid:arc:video:colbertnation.com:9aa05bd0-ed00-11e0-aca6-0026b9414f30" width="512" height="288" frameborder="0"> </iframe> </div> </div> "Feels right" that students can rate teaching. --- ### Unconscious biases against women (and URM) reflected in… -- + grant applications (e.g., [Kaatz et al., 2014](http://www.ncbi.nlm.nih.gov/pmc/articles/PMC4552397/)) -- + letters of recommendation (e.g., [Schmader et al., 2007](http://www.ncbi.nlm.nih.gov/pmc/articles/PMC2572075/), [Madera et al., 2009](http://www.academic.umn.edu/wfc/rec%20letter%20study%202009.pdf)) -- + job applications (e.g., [Moss-Racusin et al., 2012](http://www.pnas.org/content/109/41/16474.abstract), [Reuben et al., 2014](http://www.pnas.org/content/111/12/4403.abstract0)) -- + credit for joint work (e.g., [Sarsons, 2015](http://scholar.harvard.edu/files/sarsons/files/gender_groupwork.pdf?m=1449178759)) -- + .blue[teaching evaluations] --- ### Retorts: -- + But I know some women who get great scores…they even won teaching awards! -- + I know SET aren't perfect, but surely they have _some_ connection to effectiveness. -- + I get better SET when I feel the class went better. -- + Shouldn't students have a voice in evaluating teaching? --- #### Rutgers law dean asks students not to comment on women faculty dress ([IHE](https://www.insidehighered.com/news/2015/01/29/rutgers-camden-law-dean-asks-students-stop-talking-about-women-professors-attire)) 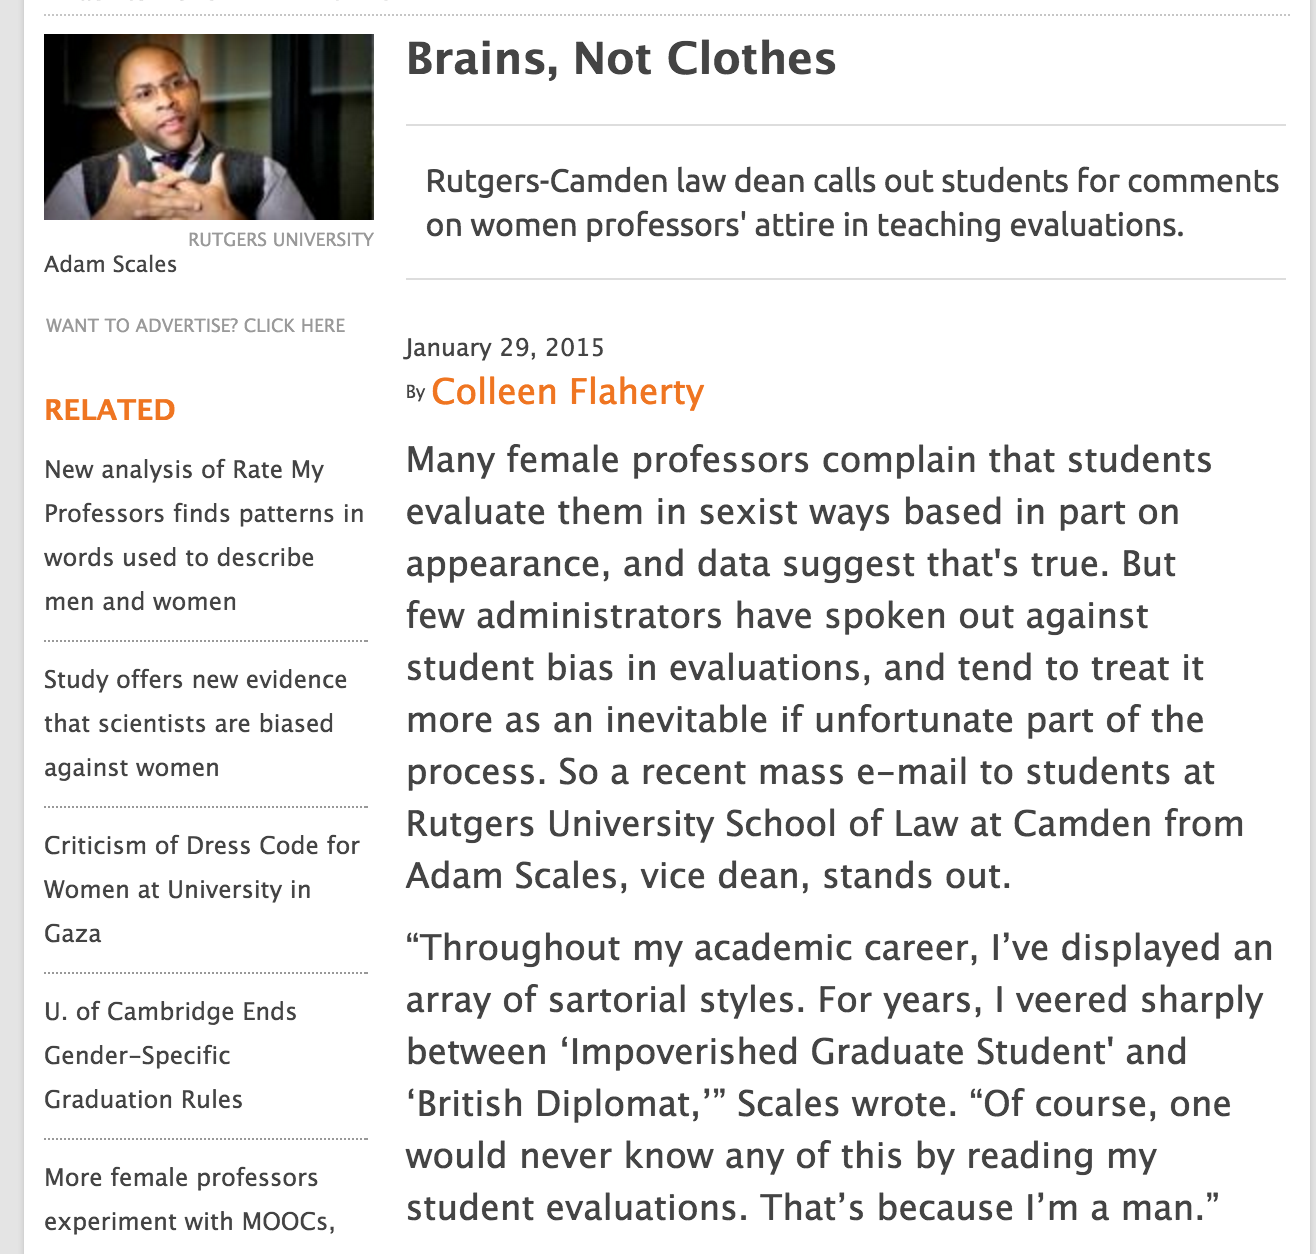 --- ### How much does appearance matter? Consider the source. <iframe width="600" height="400" src="https://www.youtube.com/embed/Xcc1Xz6XYPE?t=1m50s" frameborder="0" allowfullscreen></iframe> --- #### Adjectival frequency by gender on RateMyProfessor ([Ben Schmidt](http://benschmidt.org/profGender/#%7B%22database%22%3A%22RMP%22%2C%22plotType%22%3A%22pointchart%22%2C%22method%22%3A%22return_json%22%2C%22search_limits%22%3A%7B%22word%22%3A%5B%22cold%22%5D%2C%22department__id%22%3A%7B%22%24lte%22%3A25%7D%7D%2C%22aesthetic%22%3A%7B%22x%22%3A%22WordsPerMillion%22%2C%22y%22%3A%22department%22%2C%22color%22%3A%22gender%22%7D%2C%22counttype%22%3A%5B%22WordsPerMillion%22%5D%2C%22groups%22%3A%5B%22department%22%2C%22gender%22%5D%2C%22testGroup%22%3A%22A%22%7D)) 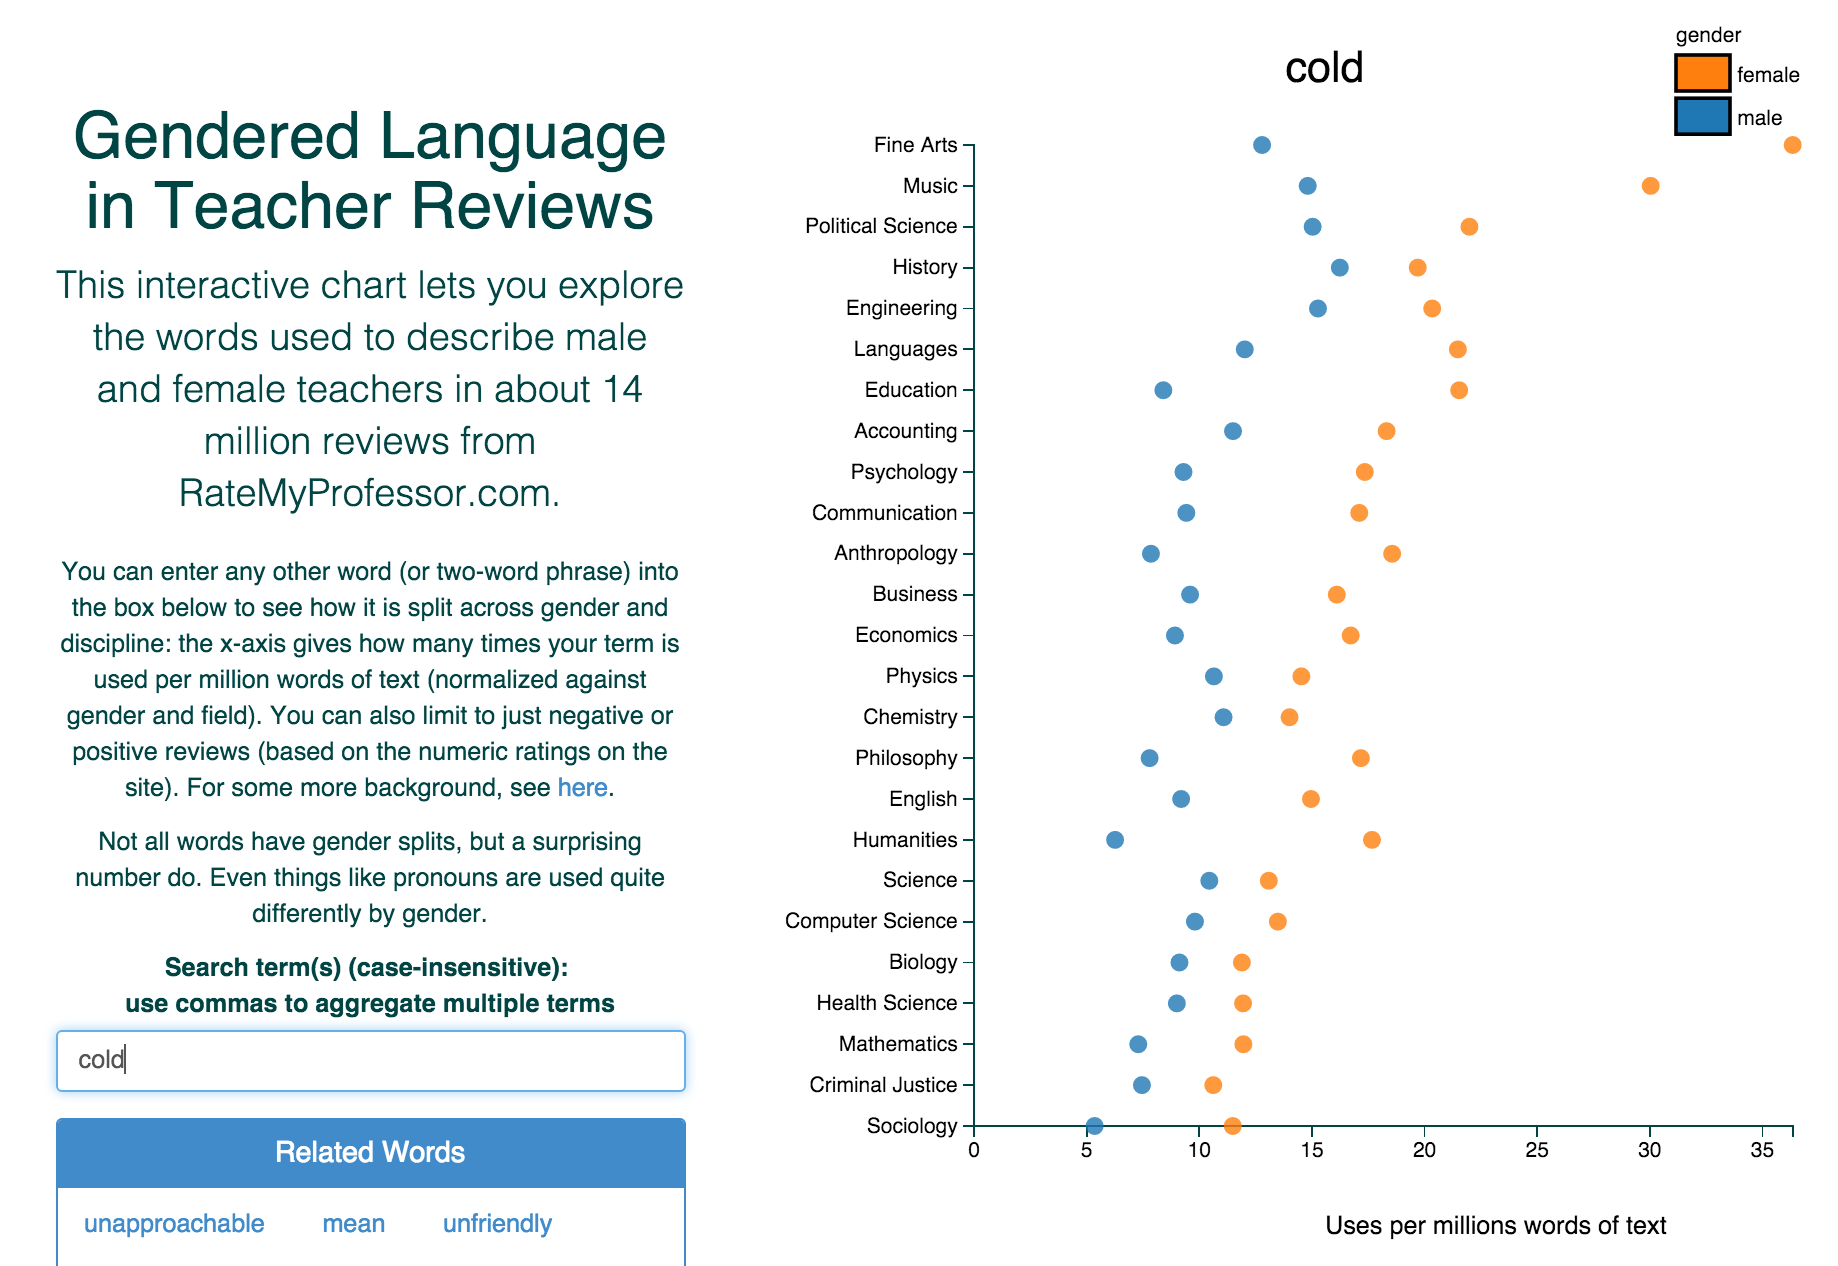 Chili peppers clearly matter for teaching effectiveness. --- #### "She does have an accent, but … " [Subtirelu 2015](doi:10.1017/S0047404514000736) 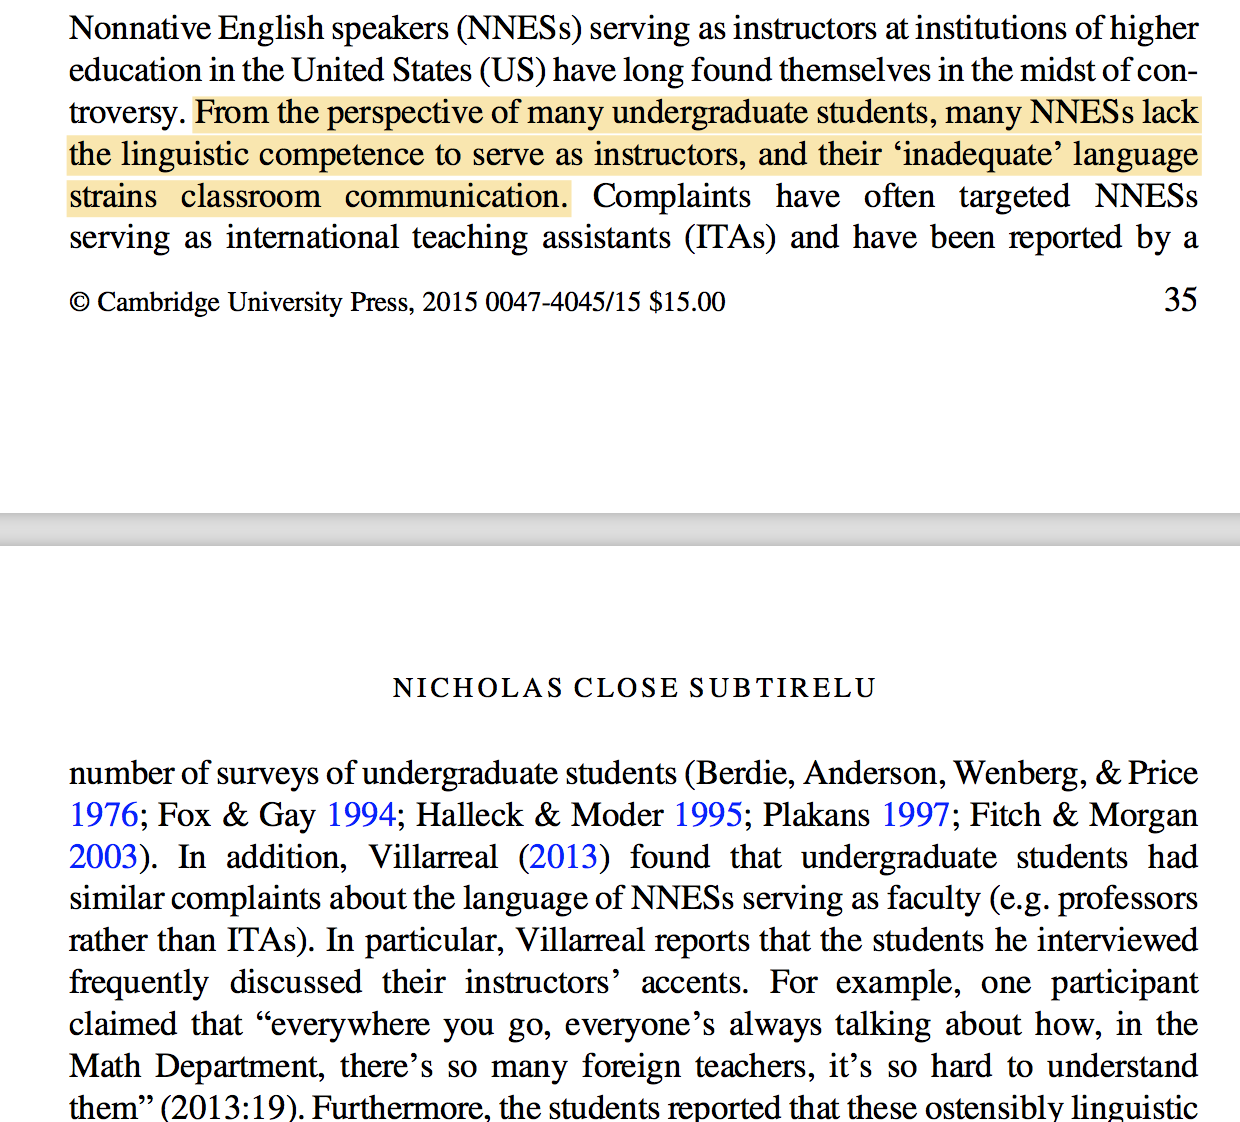 --- ## What do SET measure? - .blue[SET scores are highly correlated with students' grade expectations]<br /> Boring et al., 2016; Johnson, 2003; Marsh & Cooper, 1980; Short et al., 2012; Worthington, 2002 -- - .blue[SET scores & enjoyment scores highly correlated]<br /> Stark, unpublished, 2014 -- - .blue[instructor gender, ethnicity, attractiveness, & age matter]<br /> Anderson & Miller, 1997; Ambady & Rosenthal, 1993; Arbuckle & Williams, 2003; Basow, 1995; Boring, 2014; Boring et al., 2016; Cramer & Alexitch, 2000; Marsh & Dunkin, 1992; MacNell et al., 2014; Wachtel, 1998; Weinberg et al., 2007; Worthington, 2002 -- - .blue[omnibus questions about curriculum design, effectiveness, etc. appear most influenced by factors unrelated to learning]<br /> Worthington, 2002 --- ## Silence is priceless; attractiveness matters 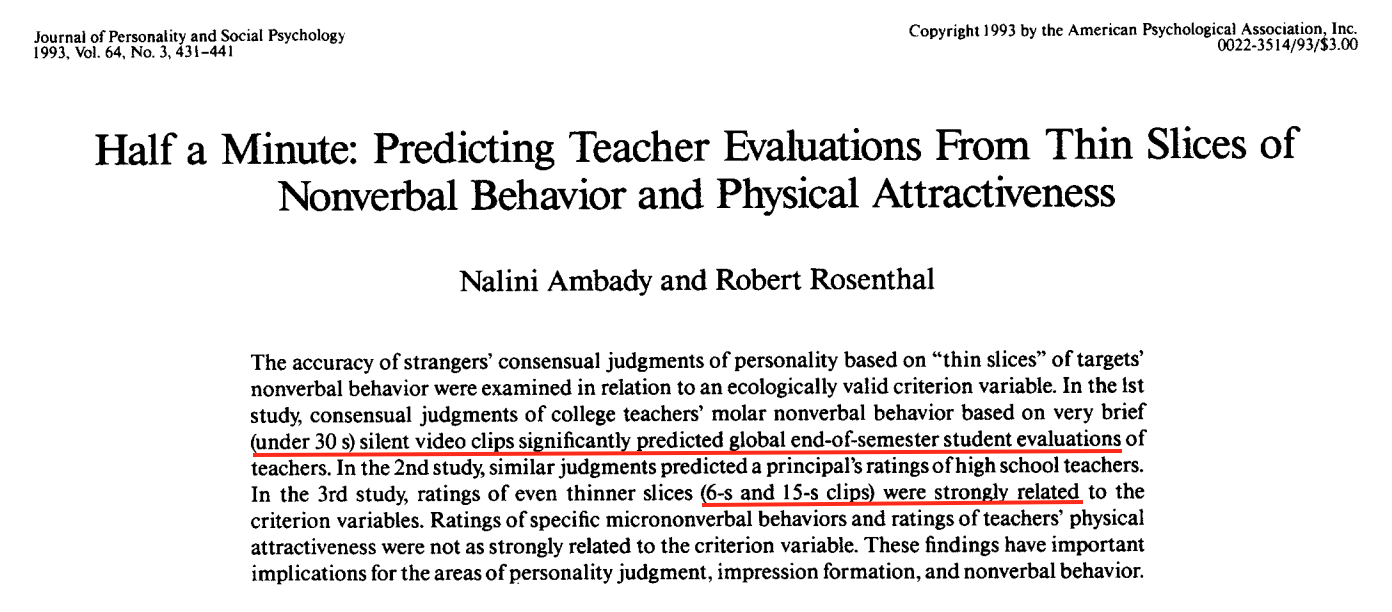 --- ## Reality is cartoonish 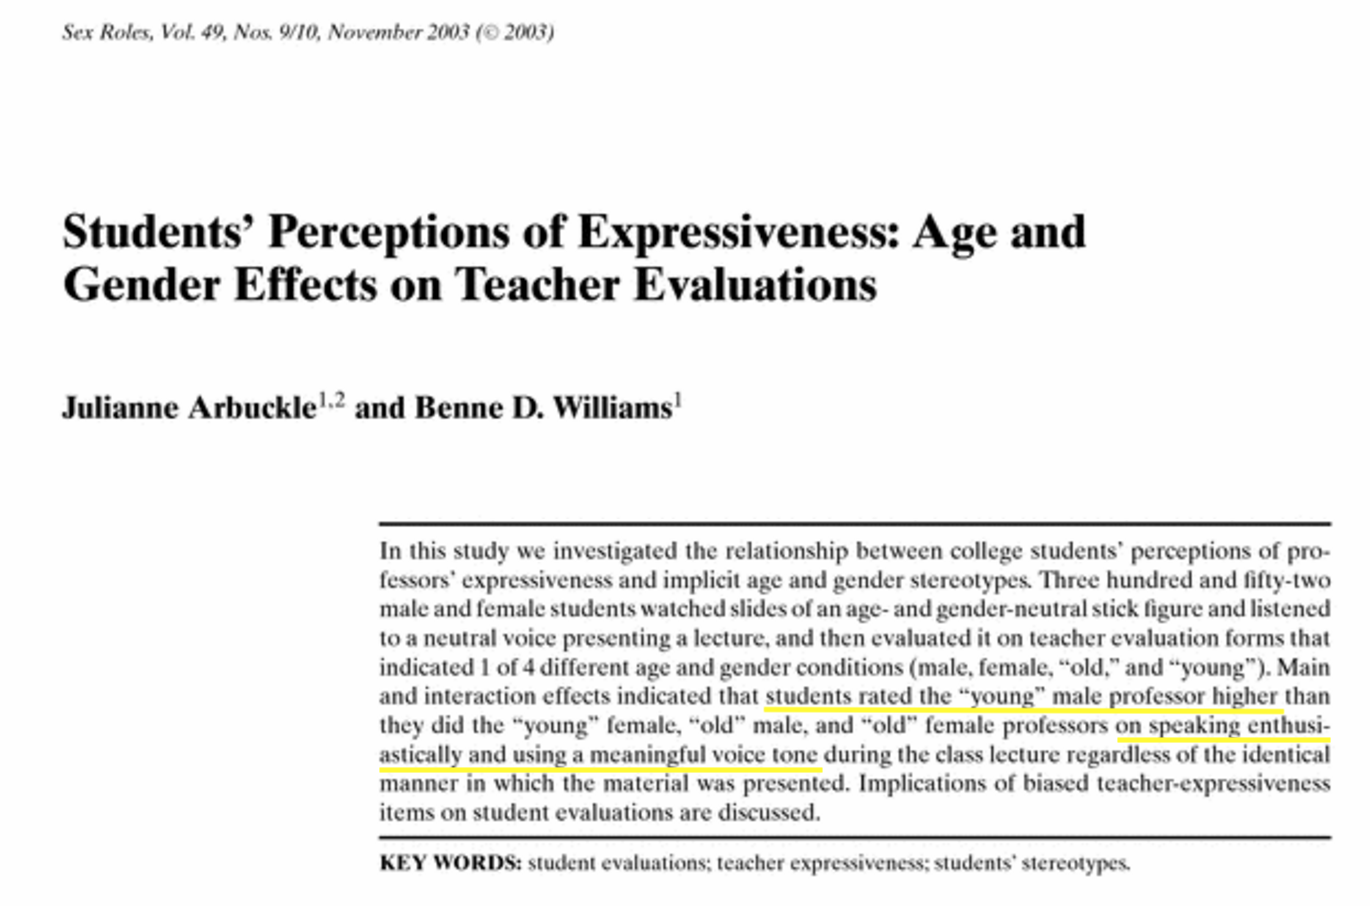 --- ## Experiments are golden Three randomized, controlled experiments: .framed.looser[ .blue[ + The US Air Force Academy: Carrell & West, 2008 + Bocconi University, Milan: Braga, Paccagnella, & Pellizzari, 2011 + NC State online course: MacNell, Driscoll, & Hunt, 2014 ]] Also "natural experiment": .framed.looser[ .blue[ + SciencesPo: Boring, 2014 ]] --- 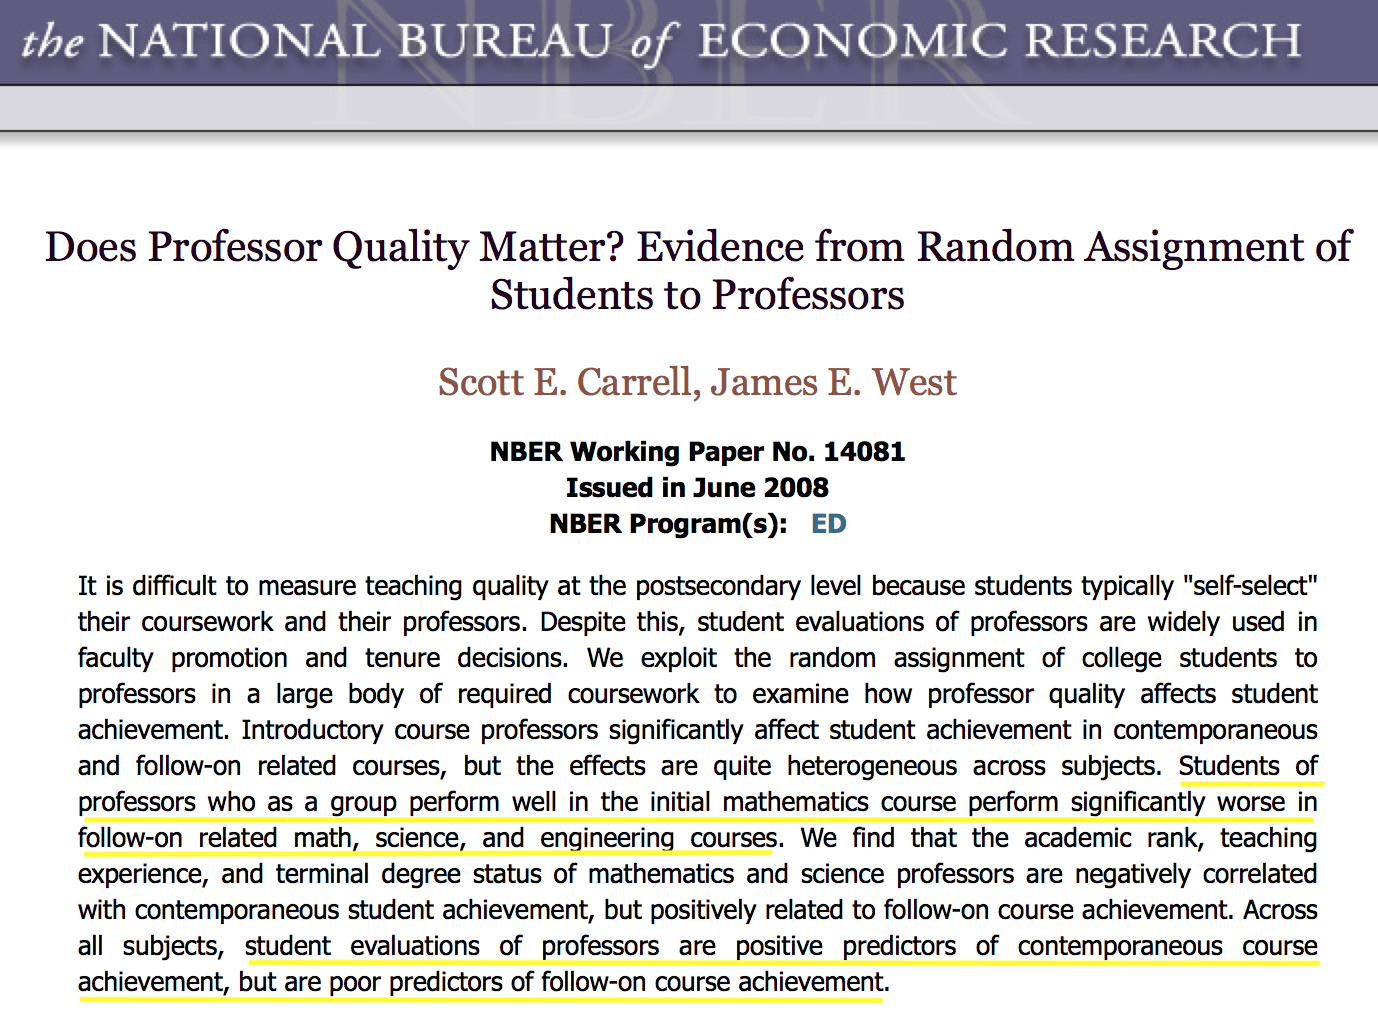 .blue["students appear to reward higher grades in the introductory course but punish professors who increase deep learning"] ---  .blue["teachers who are associated with better subsequent performance receive worst evaluations from their students. On the other hand, teachers who are associated with high grades in their own exams rank higher in the students' evaluations."] --- 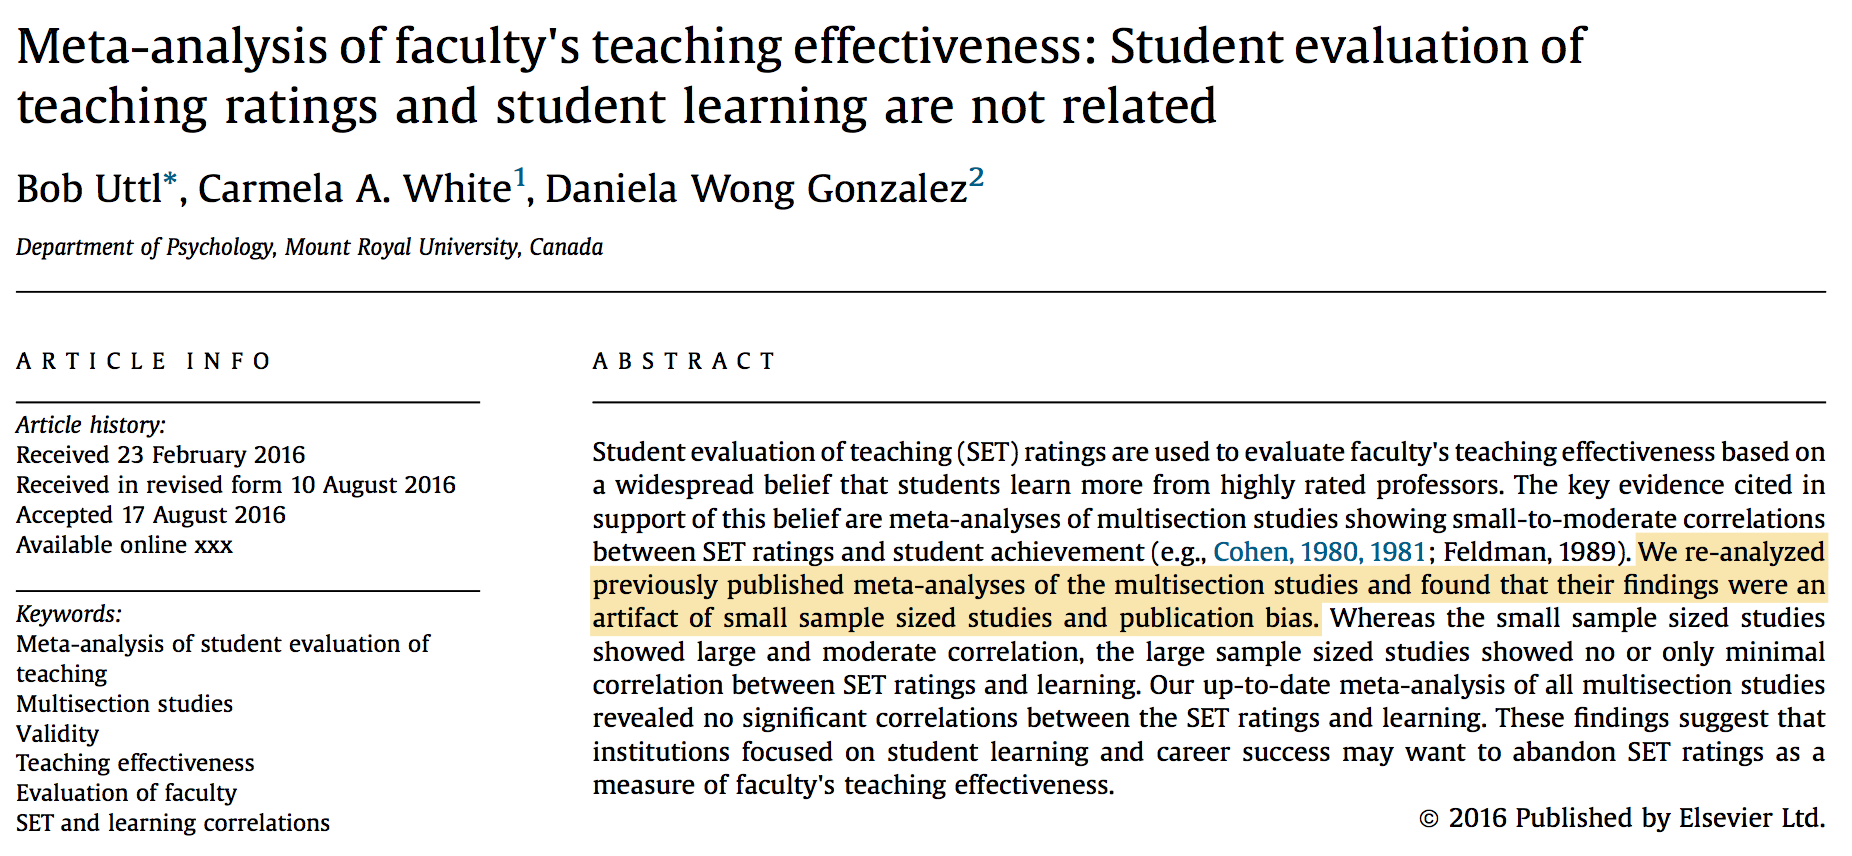 .blue["institutions focused on student learning and career success may want to abandon SET ratings as a measure of faculty's teaching effectiveness"] --- .left-column[ [MacNell, Driscoll, & Hunt, 2014]( NC State online course. Students randomized into 6 groups, 2 taught by primary prof, 4 by GSIs. 2 GSIs: 1 male 1 female. GSIs used actual names in 1 section, swapped names in 1 section. 5-point scale. ] .right-column[ .small[ <table> <tr><th> Characteristic</th> <th>M - F</th> <th>perm \(P\)</th> <th>t-test \(P\)</th></tr> <tr><td>Overall </td><td> 0.47 </td><td> 0.12 </td><td> 0.128 </td></tr> <tr><td>Professional </td><td> 0.61 </td><td> 0.07 </td><td> 0.124 </td></tr> <tr><td>Respectful </td><td> 0.61 </td><td> 0.06 </td><td> 0.124 </td></tr> <tr><td>Caring </td><td> 0.52 </td><td> 0.10 </td><td> 0.071 </td></tr> <tr><td>Enthusiastic </td><td> 0.57 </td><td> 0.06 </td><td> 0.112 </td></tr> <tr><td>Communicate </td><td> 0.57 </td><td> 0.07 </td><td> NA </td></tr> <tr><td>Helpful </td><td> 0.46 </td><td> 0.17 </td><td> 0.049 </td></tr> <tr><td>Feedback </td><td> 0.47 </td><td> 0.16 </td><td> 0.054 </td></tr> <tr><td>Prompt </td><td> 0.80 </td><td> 0.01 </td><td> 0.191 </td></tr> <tr><td>Consistent </td><td> 0.46 </td><td> 0.21 </td><td> 0.045 </td></tr> <tr><td>Fair </td><td> 0.76 </td><td> 0.01 </td><td> 0.188 </td></tr> <tr><td>Responsive </td><td> 0.22 </td><td> 0.48 </td><td> 0.013 </td></tr> <tr><td>Praise </td><td> 0.67 </td><td> 0.01 </td><td> 0.153 </td></tr> <tr><td>Knowledge </td><td> 0.35 </td><td> 0.29 </td><td> 0.038 </td></tr> <tr><td>Clear </td><td> 0.41 </td><td> 0.29 </td><td> NA </td></tr> </table> ] ] --- ### Omnibus tests 99% confidence intervals for \\(P\\) 1. perceived instructor gender plays no role \\([0.0, 5.3\times 10^{-5}]\\) 2. male students rate perceived male and female instructors the same \\([0.460, 0.468]\\) 3. female students rate perceived male and female instructors the same \\([0.0, 5.3\times 10^{-5}]\\) --- ### Exam performance and instructor gender Mean grade and instructor gender (male minus female) <table> <tr><th> </th><th> difference in means </th><th> \(P\)-value </th></tr> <tr><td> Perceived </td><td> 1.76 </td><td> 0.54 </td></tr> <tr><td> Actual </td><td> -6.81 </td><td> 0.02 </td></tr> </table> --- ### Boring et al., 2016. SciencesPo data 5 years of data for 6 mandatory freshman classes: History, Political Institutions, Microeconomics, Macroeconomics, Political Science, Sociology + SET mandatory; response rate nearly 100% + anonymous final exams except PI + interim grades before final + 23,001 SET + 379 instructors + 4,423 students + 1,194 sections (950 without PI) + 21 year-by-course strata --- ### Test statistics Correlation between SET and gender within each stratum, averaged across strata. Correlation between SET and average final exam score within each stratum, averaged across strata. --- ### SciencesPo data Average correlation between SET and final exam score <table> <tr><th> </th><th> strata </th><th> \(\bar{\rho}\) </th><th> \(P\) </th></tr> <tr><td>Overall </td><td> 26 (21) </td><td> 0.04 </td><td> 0.09 </td></tr> <tr><td>History </td><td> 5 </td><td> 0.16 </td><td> 0.01 </td></tr> <tr><td>Political Institutions </td><td> 5 </td><td> N/A </td><td> N/A </td></tr> <tr><td>Macroeconomics </td><td> 5 </td><td> 0.06 </td><td> 0.19 </td></tr> <tr><td>Microeconomics </td><td> 5 </td><td> -0.01 </td><td> 0.55 </td></tr> <tr><td>Political science </td><td> 3 </td><td> -0.03 </td><td> 0.62 </td></tr> <tr><td>Sociology </td><td> 3 </td><td> -0.02 </td><td> 0.61 </td></tr> </table> --- Average correlation between SET and instructor gender <table> <tr><th> </th><th> \(\bar{\rho}\) </th><th> \(P\) </th></tr> <tr><td>Overall </td><td> 0.09 </td><td> 0.00 </td></tr> <tr><td>History </td><td> 0.11 </td><td> 0.08 </td></tr> <tr><td>Political institutions </td><td> 0.11 </td><td> 0.10 </td></tr> <tr><td>Macroeconomics </td><td> 0.10 </td><td> 0.16 </td></tr> <tr><td>Microeconomics </td><td> 0.09 </td><td> 0.16 </td></tr> <tr><td>Political science </td><td> 0.04 </td><td> 0.63 </td></tr> <tr><td>Sociology </td><td> 0.08 </td><td> 0.34 </td></tr> </table> --- Average correlation between final exam scores and instructor gender <table> <tr><th> </th><th> \(\bar{\rho}\) </th><th> \(P\) </th></tr> <tr><td>Overall </td><td> -0.06 </td><td> 0.07 </td></tr> <tr><td>History </td><td> -0.08 </td><td> 0.22 </td></tr> <tr><td>Macroeconomics </td><td> -0.06 </td><td> 0.37 </td></tr> <tr><td>Microeconomics </td><td> -0.06 </td><td> 0.37 </td></tr> <tr><td>Political science </td><td> -0.03 </td><td> 0.70 </td></tr> <tr><td>Sociology </td><td> -0.05 </td><td> 0.55 </td></tr> </table> --- Average correlation between SET and gender concordance <table> <tr><th> </th><th colspan="2"> Male student </th><th> </th><th colspan="2">Female student </th></tr> <tr><th></th><th> \(\bar{\rho}\) </th><th> \(P\) </th><th></th><th> \(\bar{\rho}\) </th><th> \(P\) </th></tr> <tr><td> Overall </td><td> 0.15 </td><td> 0.00 </td><td> </td><td> 0.05 </td><td> 0.09 </td></tr> <tr><td> History </td><td> 0.17 </td><td> 0.01 </td><td> </td><td> -0.03 </td><td> 0.60 </td></tr> <tr><td> Political institutions </td><td> 0.12 </td><td> 0.08 </td><td> </td><td> -0.11 </td><td> 0.12 </td></tr> <tr><td> Macroeconomics </td><td> 0.14 </td><td> 0.04 </td><td> </td><td> -0.05 </td><td> 0.49 </td></tr> <tr><td> Microeconomics </td><td> 0.18 </td><td> 0.01 </td><td> </td><td> -0.00 </td><td> 0.97 </td></tr> <tr><td> Political science </td><td> 0.17 </td><td> 0.06 </td><td> </td><td> 0.04 </td><td> 0.64 </td></tr> <tr><td> Sociology </td><td> 0.12 </td><td> 0.16 </td><td> </td><td> -0.03 </td><td> 0.76 </td></tr> </table> --- Average correlation between student performance and gender concordance <table> <tr><th> </th><th colspan="2">Male student </th><th> </th><th colspan="2">Female student</th></tr> <tr><th></th><th> \(\bar{\rho}\) </td><td> \(P\) </th><th></th><th> \(\bar{\rho}\) </th><th> \(P\) </th></tr> <tr><td> Overall </td><td> -0.01 </td><td> 0.75 </td><td> </td><td> 0.06 </td><td> 0.07 </td></tr> <tr><td> History </td><td> -0.15 </td><td> 0.03 </td><td> </td><td> -0.02 </td><td> 0.74 </td></tr> <tr><td> Macroeconomics </td><td> 0.04 </td><td> 0.60 </td><td> </td><td> 0.11 </td><td> 0.10 </td></tr> <tr><td> Microeconomics </td><td> 0.02 </td><td> 0.80 </td><td> </td><td> 0.07 </td><td> 0.29 </td></tr> <tr><td> Political science </td><td> 0.08 </td><td> 0.37 </td><td> </td><td> 0.11 </td><td> 0.23 </td></tr> <tr><td> Sociology </td><td> 0.01 </td><td> 0.94 </td><td> </td><td> 0.06 </td><td> 0.47 </td></tr> </table> --- Average correlation between SET and interim grades <table> <tr><th> </th><th> \(\bar{\rho}\) </th><th> \(P\) </th></tr> <tr><td>Overall </td><td> 0.16 </td><td> 0.00 </td></tr> <tr><td>History </td><td> 0.32 </td><td> 0.00 </td></tr> <tr><td>Political institutions </td><td> -0.02 </td><td> 0.61 </td></tr> <tr><td>Macroeconomics </td><td> 0.15 </td><td> 0.01 </td></tr> <tr><td>Microeconomics </td><td> 0.13 </td><td> 0.03 </td></tr> <tr><td>Political science </td><td> 0.17 </td><td> 0.02 </td></tr> <tr><td>Sociology </td><td> 0.24 </td><td> 0.00 </td></tr> </table> --- ### Main conclusions; multiplicity 1. lack of association between SET and final exam scores (negative result, so multiplicity not an issue) 1. lack of association between instructor gender and final exam scores (negative result, so multiplicity not an issue) 1. association between SET and instructor gender 1. association between SET and interim grades Bonferroni's adjustment for four tests leaves the associations highly significant: adjusted \\(P < 0.01\\). --- ### Whence the \\(P\\)-values? Why not t-test, ANOVA, regression, etc.? -- #### Permutation tests + Under the null hypothesis, the probability distribution of the data is invariant with respect to the action of some group. -- + Condition on the orbit of the data under the action of the group (or a subgroup). -- + Every element of that orbit is equally likely. -- No assumptions about populations, data distributions, etc. --- ### Neyman model generalized for MacNell et al. data Student \\(i\\) represented by ticket w 4 numbers, response to each "treatment." $$ r_{ijk} = \mbox{ SET given by student } i \mbox{ to instructor } j \mbox{ when appears to have gender } k. $$ $$ i = 1, \ldots, N; \;\;\; j = 1, 2; \;\;\; k \in \\{ \mbox{male}, \mbox{female} \\} $$ -- Numbers fixed before randomization into 1 of 4 treatments. -- Randomization reveals 1 of the numbers. -- Implicit non-interference: each student's response depends only on that student's treatment. -- If gender doesn't matter, $$ r\_{ij\mbox{ male}} = r\_{ij\mbox{ female}}. $$ --- ### Randomization $$ {{N}\choose{N\_1 N\_2 N\_3 N\_4}} = \frac{N!}{N\_1! N\_2! N\_3! N\_4!} $$ possible assignments of \\(N\_1\\) students to TA 1 identified as male, \\(N\_2\\) students to TA 1 identified as female, etc. Equally likely. -- Hence, so are the $$ {{N\_1 + N\_2} \choose {N\_1}} \times {{N\_3+N\_4} \choose {N\_3}} $$ assignments that keep the same \\(N_1 + N_2\\) students in TA 1's sections & the same \\(N_3 + N_4\\) students in TA 2's sections. For those, we know what the data would have been, if the null hypothesis were true. Condition on assignments to prof & 2 TAs and on nonresponders. -- .blue[Determines (conditional) null distribution of any test statistic] Conditional \\(P\\)-value is fraction of assignments with at least as large test statistic. --- ### \\(P\\)-values In principle, enumerate all assignments and calculate test statistic for each. But $$ {{23}\choose{11}}{{24}\choose{11}} > 3.3\times 10^{12} $$ possible assignments of 47 students to the 4 TA-led sections that keep constant which students get which TA. Use \\(10^5\\) random assignments. \\(\mbox{SE}(\hat{P}) \le (1/2)/ \sqrt{10^5} \approx 0.0016\\) Can also find confidence intervals for \\(P\\) by inverting binomial tests. --- ### French data If instructor characteristics or grade expectations are unrelated to SET, every pairing within a stratum is equally likely. Condition on all numerical values, but not the pairings. Strata (course by year) assumed to be independent. Each classes' response depends only on which instructor is assigned to that class; interference among students in a section is OK. --- ### Omnibus alternatives: nonparametric combination of tests Combine test statistics across strata or across variables for a test of conjunction Fisher's combining function: $$ X^2 = -2 \sum\_{j=1}^J \ln P\_j. $$ -- \\( X^2 \sim \chi^2\_{2J} \\) if \\(\\{ P\_j \\}\_{j=1}^J\\) are independent & all nulls are true -- But here, tests are dependent: calibrate combination by simulation. -- + Each replication is a Bernoulli(\\(P\\)) trial; trials are independent. + Number of replications with test statistic ≥ observed is binomial. + Invert binomial hypothesis tests to find confidence bounds for \\(P\\) --- ## [Permute](http://statlab.github.io/permute/) library Millman, Ottoboni, Stark, van der Walt, 2016 [Source code on GitHub](https://github.com/statlab/permute) [Installable from Pypi](https://pypi.python.org/pypi/permute/) --- ### Algorithmic & design considerations + Reproducibility + Appropriate level of abstraction - tests, test statistics - effect sizes & confidence bounds in \\(k\\)-sample problem + Utilities & building blocks to craft "permutation tests for all occasions" + Stratification supported for all tests + Conditioned permutations (e.g., tables w/ fixed margins) + Memory & CPU time - efficient permutation in place (numpy.random.permutation() v numpy.random.shuffle()) - nonparametric combination of tests methodology: "aligned" permutations - cython & C --- ### What are we measuring? US data: controls for _everything_ but the name, since compares each TA to him/herself. French data: controls for subject, year, teaching effectiveness --- ### Who supports SET? .framed[ .blue[ >> It is difficult to get a man to understand something, when his salary depends upon his not understanding it! —Upton Sinclair ] ] --- ### Benton & Cashin, 2012: exemplar SET apologists + Widely cited, but it's a technical report from IDEA, a business that sells SET. -- + Claims SET are reliable and valid. -- + Does not cite Carrell & West (2008) or Braga et al. (2011), the only two randomized experiments I know of published before B&C (2012) -- + As far as I can tell, no study B&C cite in support of validity used randomization. --- ### Benton & Cashin on validity >> Theoretically, the best indicant of effective teaching is student learning. Other things being equal, the students of more effective teachers should learn more. -- I agree. -- >> A number of studies have attempted to examine this hypothesis by comparing multiple-section courses. For example, Benton and colleagues (Benton, Duchon, & Pallett, 2011) examined student ratings in multiple sections of the same course taught by the same instructor. They correlated student ratings of progress on objectives the instructor identified as relevant to the course (using IDEA student ratings) with their performance on exams tied to those objectives. Student ratings correlated positively with four out of five exams and with the course total points (r = .32). .blue[What's wrong with this argument?] --- #### Again, address a straw man hypothesis: - Who claims SET have **absolutely no connection** to teaching effectiveness? -- - SET are associated with class enjoyment, which may affect engagement & learning >UCB Dept. Stat, fall 2012, 1486 students rated instructor overall effectiveness & enjoyment of the course. -- .blue[ > Correlation btw instructor effectiveness & enjoyment: 0.75.<br /> Correlation btw course effectiveness & enjoyment: 0.8. ] -- - .red[question is not whether there's _any_ association between SET and effectiveness.] .blue[question is _how well_ SET measure effectiveness, and whether factors unrelated to effectiveness are confounded enough that SET is misleading or discriminatory] -- + Association at the student level Benton et al. find means individual students who rate _the same instructor_ higher get higher scores. -- + Doesn't show SET are valid—seems to show SET are not reliable! --- + \\(r =0.32\\) is very weak for \\(n=188\\) - if relationship is linear, SET accounts for just 10% of the variance of performance - c.f. \\(r=0.8\\) for course effectiveness & enjoyment \\(n=1486\\) -- + The underlying data do not come from a randomized experiment. - no real controls (e.g., pretest); no basis for a statistical conclusion - likely confounding from many factors --- ## What's the right question? + Are SET more sensitive to effectiveness or to something else? + Do women and men get comparable SET? + But for their gender, would women get higher SET than they do? (And but for their gender, would men get lower SET than they do?) Need to compare like teaching with like teaching, not an arbitrary collection of women with an arbitrary collection of men. Boring (2014) finds _costs_ of improving SET very different for men and women. --- ## These are not the only biases! + Ethnicity and race + Attractiveness + Accents ... --- ### SET do not measure teaching effectiveness + Calling something "teaching effectiveness" does not make it so + Averaging Likert ratings doesn't make sense: scale isn't proportional + Compute averages to 2 decimals doesn't make the averages meaningful or comparable + Courses are largely incommensurable: comparing averages across sizes, levels, disciplines, types of course, electives v. requirements, etc., is silly --- ### What might we be able to discover about teaching? .looser[ + Is she dedicated to and engaged in her teaching? + Is she available to students? + Is she putting in appropriate effort? Is she creating new materials, new courses, or new pedagogical approaches? + Is she revising, refreshing, and reworking existing courses using feedback and on-going experiment? + Is she helping keep the department's curriculum up to date? + Is she trying to improve? + Is she contributing to the college's teaching mission in a serious way? + Is she supervising undergraduates for research, internships, and honors theses? + Is she advising and mentoring students? + Do her students do well when they graduate? ] --- ### UCB Dept of Statistics policy since 2013 -- + Candidates prepare a teaching portfolio, including teaching statement, syllabi, notes, websites, assignments, exams, videos, statements on mentoring, & anything else the candidate wants to include. -- + Dept. chair & promotion committee assess portfolio. -- + Peer observation: before every "milestone” review (mid-career, tenure, full, step VI), observe at least 1 class -- + Report response rates & distributions of SET, but not average SET. -- + Summarize themes of comments. --- ### How hard/expensive is it? .blue[Classroom observation took the reviewer about four hours, including the observation time itself.] Process included conversations between the candidate and the observer, opportunity for the candidate to respond to the written comments, & provision for a "no-fault do-over." -- .blue[If done for every milestone review, would be ≈16h over a 40-year _career_: de minimis.] Candidates & reviewer reported that the process was valuable and interesting. Based on that experience, the dean recommended peer observation prior to milestone reviews; the next dean reversed that decision. -- Room for improvement: Observing >1 class and >1 course would be better. Adding informal observation and discussion between reviews would be better. Periodic surveys of former students, advisees, and teaching assistants would be useful. -- But still this improves on using SET alone. --- ### Example letter for a strong teacher (almalgam of real letters) Smith is, by all accounts, an excellent teacher, as confirmed by the classroom observations of Prof. Jones, who calls out Smith's ability to explain key concepts in a broad variety of ways, to hold the attention of the class throughout a 90-minute session, to use both the board and slides effectively, and to engage a large class in discussion. Prof. Jones's peer observation report is included in the case materials; conversations with Jones confirm that the report is Jones's candid opinion: Jones was impressed, and commented in particular on Smith's rapport with the class, Smith's sensitivity to the mood in the room and whether students were following the presentation, Smith's facility in blending derivations on the board with projected computer simulations to illustrate the mathematics, and Smith's ability to construct alternative explanations and illustrations of difficult concepts when students did not follow the first exposition. --- #### letter (contd) Examples of comments on Smith's teaching include: > I was dreading taking a statistics course, but after this class, I decided to major in statistics. > the best I've ever met … hands down best teacher I've had in 10 years of university education > overall amazing … she is the best teacher I have ever had > absolutely love it > loves to teach, humble, always helpful > extremely clear … amazing professor > awesome, clear > highly recommended > just an amazing lecturer > great teacher … best instructor to date > inspiring and an excellent role model > the professor is GREAT Critical student comments primarily concerned the difficulty of the material or the homework. None of the critical comments reflected on the pedagogy or teaching effectiveness, only the workload. --- #### letter (contd) I reviewed Smith's syllabus, assignments, exams, lecture notes, and other materials for Statistics X (a prerequisite for many majors), Y (a seminar course she developed), Z (a graduate course she developed for the revised MA program, which she has spearheaded), and Q (a topics course in her research area). They are very high quality and clearly the result of considerable thought and effort. In particular, Smith devoted an enormous amount of time to developing online materials for X over the last five years. The materials required designing and creating a substantial amount of supporting technology, representing at least 500 hours per year of effort to build and maintain. T he undertaking is highly creative and advanced the state of the art. Not only are those online materials superb, they are having an impact on pedagogy elsewhere: a Google search shows over 1,200 links to those materials, of which more than half are from other countries. I am quite impressed with the pedagogy, novelty, and functionality. I have a few minor suggestions about the content, which I will discuss with Smith, but those are a matter of taste, not of correctness. The materials for X and Y are extremely polished. Notably, Smith assigned a term project in an introductory course, harnessing the power of inquiry-based learning. I reviewed a handful of the term projects, which were ambitious and impressive. The materials for Z and Q are also well organized and interesting, and demand an impressively high level of performance from the students. The materials for Q include a great selection of data sets and computational examples that are documented well. Overall, the materials are exemplary; I would estimate that they represent well over 1,500 hours of development during the review period. --- #### letter (contd) Smith's lectures in X were webcast in fall, 2013. I watched portions of a dozen of Smith's recorded lectures for X—a course I have taught many times. Smith's lectures are excellent: clear, correct, engaging, interactive, well paced, and with well organized and legible boardwork. Smith does an admirable job keeping the students involved in discussion, even in large (300+ student) lectures. Smith is particularly good at keeping the students thinking during the lecture and of inviting questions and comments. Smith responds generously and sensitively to questions, and is tuned in well to the mood of the class. Notably, some of Smith's lecture videos have been viewed nearly 300,000 times! This is a testament to the quality of Smith's pedagogy and reach. Moreover, these recorded lectures increase the visibility of the Department and the University, and have garnered unsolicited effusive thanks and praise from across the world. Conversations with teaching assistants indicate that Smith spent a considerable amount of time mentoring them, including weekly meetings and observing their classes several times each semester. She also played a leading role in revising the PhD curriculum in the department. --- #### letter (contd) Smith participated in two campus-wide seminars on improving teaching during the review period, and led a breakout session on working with GSIs. Smith also taught the GSI pedagogy course last semester. Smith has been quite active as an advisor to graduate students. In addition to serving as a member of sixteen exam committees and more than a dozen MA and PhD committees, she advised three PhD recipients (all of whom got jobs in top-ten departments), co-advised two others, and is currently advising three more. Smith advised two MA recipients who went to jobs in industry, co-advised another who went to a job in government, advised one who changed advisors. Smith is currently advising a fifth. Smith supervised three undergraduate honors theses and two undergraduate internships during the review period. This is an exceptionally strong record of teaching and mentoring for an assistant professor. Smith's teaching greatly exceeds expectations. --- ### Example letter for a less engaged teacher During the review period, Smythe taught the standard departmental load of three courses per year, a total of nine courses. Smythe has taught these courses for the last 15 years. The course materials were last updated in 2003. Student comments suggest that the examples could stand refreshing. Students reported having trouble reading Smythe's handwritten transparencies; students have made similar comments for the last 15 years. Students also reported that Smythe cancelled class on several occasions with no notice and did not schedule office hours. Smythe did not serve on any PhD oral exam committees or thesis committees during the review period, nor did Smythe supervise any graduate students or undergraduate research students. --- ### How can students help evaluate teaching? Report their own experience of the class. + Did you enjoy the class? + Compared to other classes, did you find the class easy or hard? Interesting or boring? Time-consuming? + Did you leave it more enthusiastic or less enthusiastic about the subject matter? + What was your favorite part of the course? + What was your least favorite part of the course? + Would you recommend this course to other students? Why or why not? + If this was an elective: - did you plan to take a sequel before taking this course? - do you now plan to take a sequel course? + Could you hear the instructor during lectures? + Was the instructor's handwriting legible? --- #### Policy implications 1. Well-designed, randomized experiments show that SET are more sensitive to gender biases and grade expectations better than to teaching effectiveness. 1. .blue[Impact of relying on SET for employment decisions:] Discrimination against women & ethnic minorities, rewarding less effective teaching, punishing more effective teaching. 1. SET should not be used as a measure of teaching effectiveness and should play no role in employment decisions. 1. Pay attention to student comments but understand the limitations and heed differences in usage. 1. Responders are not a random sample; no reason their responses should be representative of the class as a whole: do not extrapolate. 1. Use teaching portfolios as part of the review process. 1. Use classroom observation as part of milestone reviews. 1. To improve teaching and evaluate teaching fairly and honestly, spend time observing teaching & teaching materials, not SET. --- ### Meta-message + It's easy to think we're being objective and rational when we base our decisions on data and numbers. -- + But if the data are subjective (or low quality) or the numbers and not well connected to the goal, it's irrational to rely on them: they are unfit for the purpose. -- + It may be far better to use a qualitative approach involving careful observation and judgement. -- + Measuring inputs reasonably might be better than pretending to measure outputs. -- .framed.looser.red[ + Not all evidence is numerical. + Not all numbers are evidence. + Beware quantifauxcation! ] --- #### References + Ambady, N., and R. Rosenthal, 1993. Half a Minute: Predicting Teacher Evaluations from Thin Slices of Nonverbal Behavior and Physical Attractiveness, _J. Personality and Social Psychology_, _64_, 431-441. + Arbuckle, J. and B.D. Williams, 2003. Students' Perceptions of Expressiveness: Age and Gender Effects on Teacher Evaluations, _Sex Roles_, _49_, 507-516. DOI 10.1023/A:1025832707002 + Archibeque, O., 2014. Bias in Student Evaluations of Minority Faculty: A Selected Bibliography of Recent Publications, 2005 to Present. http://library.auraria.edu/content/bias-student-evaluations-minority-faculty (last retrieved 30 September 2016) + Basow, S., S. Codos, and J. Martin, 2013. The Effects of Professors' Race and Gender on Student Evaluations and Performance, _College Student Journal_, _47_ (2), 352-363. + Boring, A., 2015. Gender Bias in Student Evaluations of Teachers, OFCE-PRESAGE-Sciences-Po Working Paper, http://www.ofce.sciences-po.fr/pdf/dtravail/WP2015-13.pdf (last retrieved 30 September 2016) + Boring, A., K. Ottoboni, and P.B. Stark, 2016. Student Evaluations of Teaching (Mostly) Do Not Measure Teaching Effectiveness, _ScienceOpen_, DOI 10.14293/S2199-1006.1.SOR-EDU.AETBZC.v1 + Braga, M., M. Paccagnella, and M. Pellizzari, 2014. Evaluating Students' Evaluations of Professors, _Economics of Education Review_, _41_, 71-88. + Carrell, S.E., and J.E. West, 2010. Does Professor Quality Matter? Evidence from Random Assignment of Students to Professors, _J. Political Economy_, _118_, 409-432. --- + Johnson, V.E., 2003. Grade Inflation: A Crisis in College Education, Springer-Verlag, NY, 262pp. + Lauer, C., 2012. A Comparison of Faculty and Student Perspectives on Course Evaluation Terminology, in _To Improve the Academy: Resources for Faculty, Instructional, and Educational Development_, _31_, J.E. Groccia and L. Cruz, eds., Jossey-Bass, 195-211. + MacNell, L., A. Driscoll, and A.N. Hunt, 2015. What's in a Name: Exposing Gender Bias in Student Ratings of Teaching, _Innovative Higher Education_, _40_, 291-303. DOI 10.1007/s10755-014-9313-4 + Schmidt, B., 2015. Gendered Language in Teacher Reviews, http://benschmidt.org/profGender (last retrieved 30 September 2016) + Stark, P.B., and R. Freishtat, 2014. An Evaluation of Course Evaluations, _ScienceOpen_, DOI 10.14293/S2199-1006.1.SOR-EDU.AOFRQA.v1 + Subtirelu, N.C., 2015. "She does have an accent but…": Race and language ideology in students' evaluations of mathematics instructors on RateMyProfessors.com, _Language in Society_, _44_, 35-62. DOI 10.1017/S0047404514000736 + Uttl, B., C.A. White, and A. Morin, 2013. The Numbers Tell it All: Students Don't Like Numbers!, _PLoS ONE_, _8_ (12): e83443, DOI 10.1371/journal.pone.0083443 + Uttl, B., C.A. White, and D.W. Gonzalez, 2016. Meta-analysis of Faculty's Teaching Effectiveness: Student Evaluation of Teaching Ratings and Student Learning Are Not Related, _Studies in Educational Evaluation_, DOI: 0.1016/j.stueduc.2016.08.007 --- ### A note on open, transparent science MacNell et al. data available at http://n2t.net/ark:/b6078/d1mw2k (Merritt) French law prohibits publishing SciencesPo data 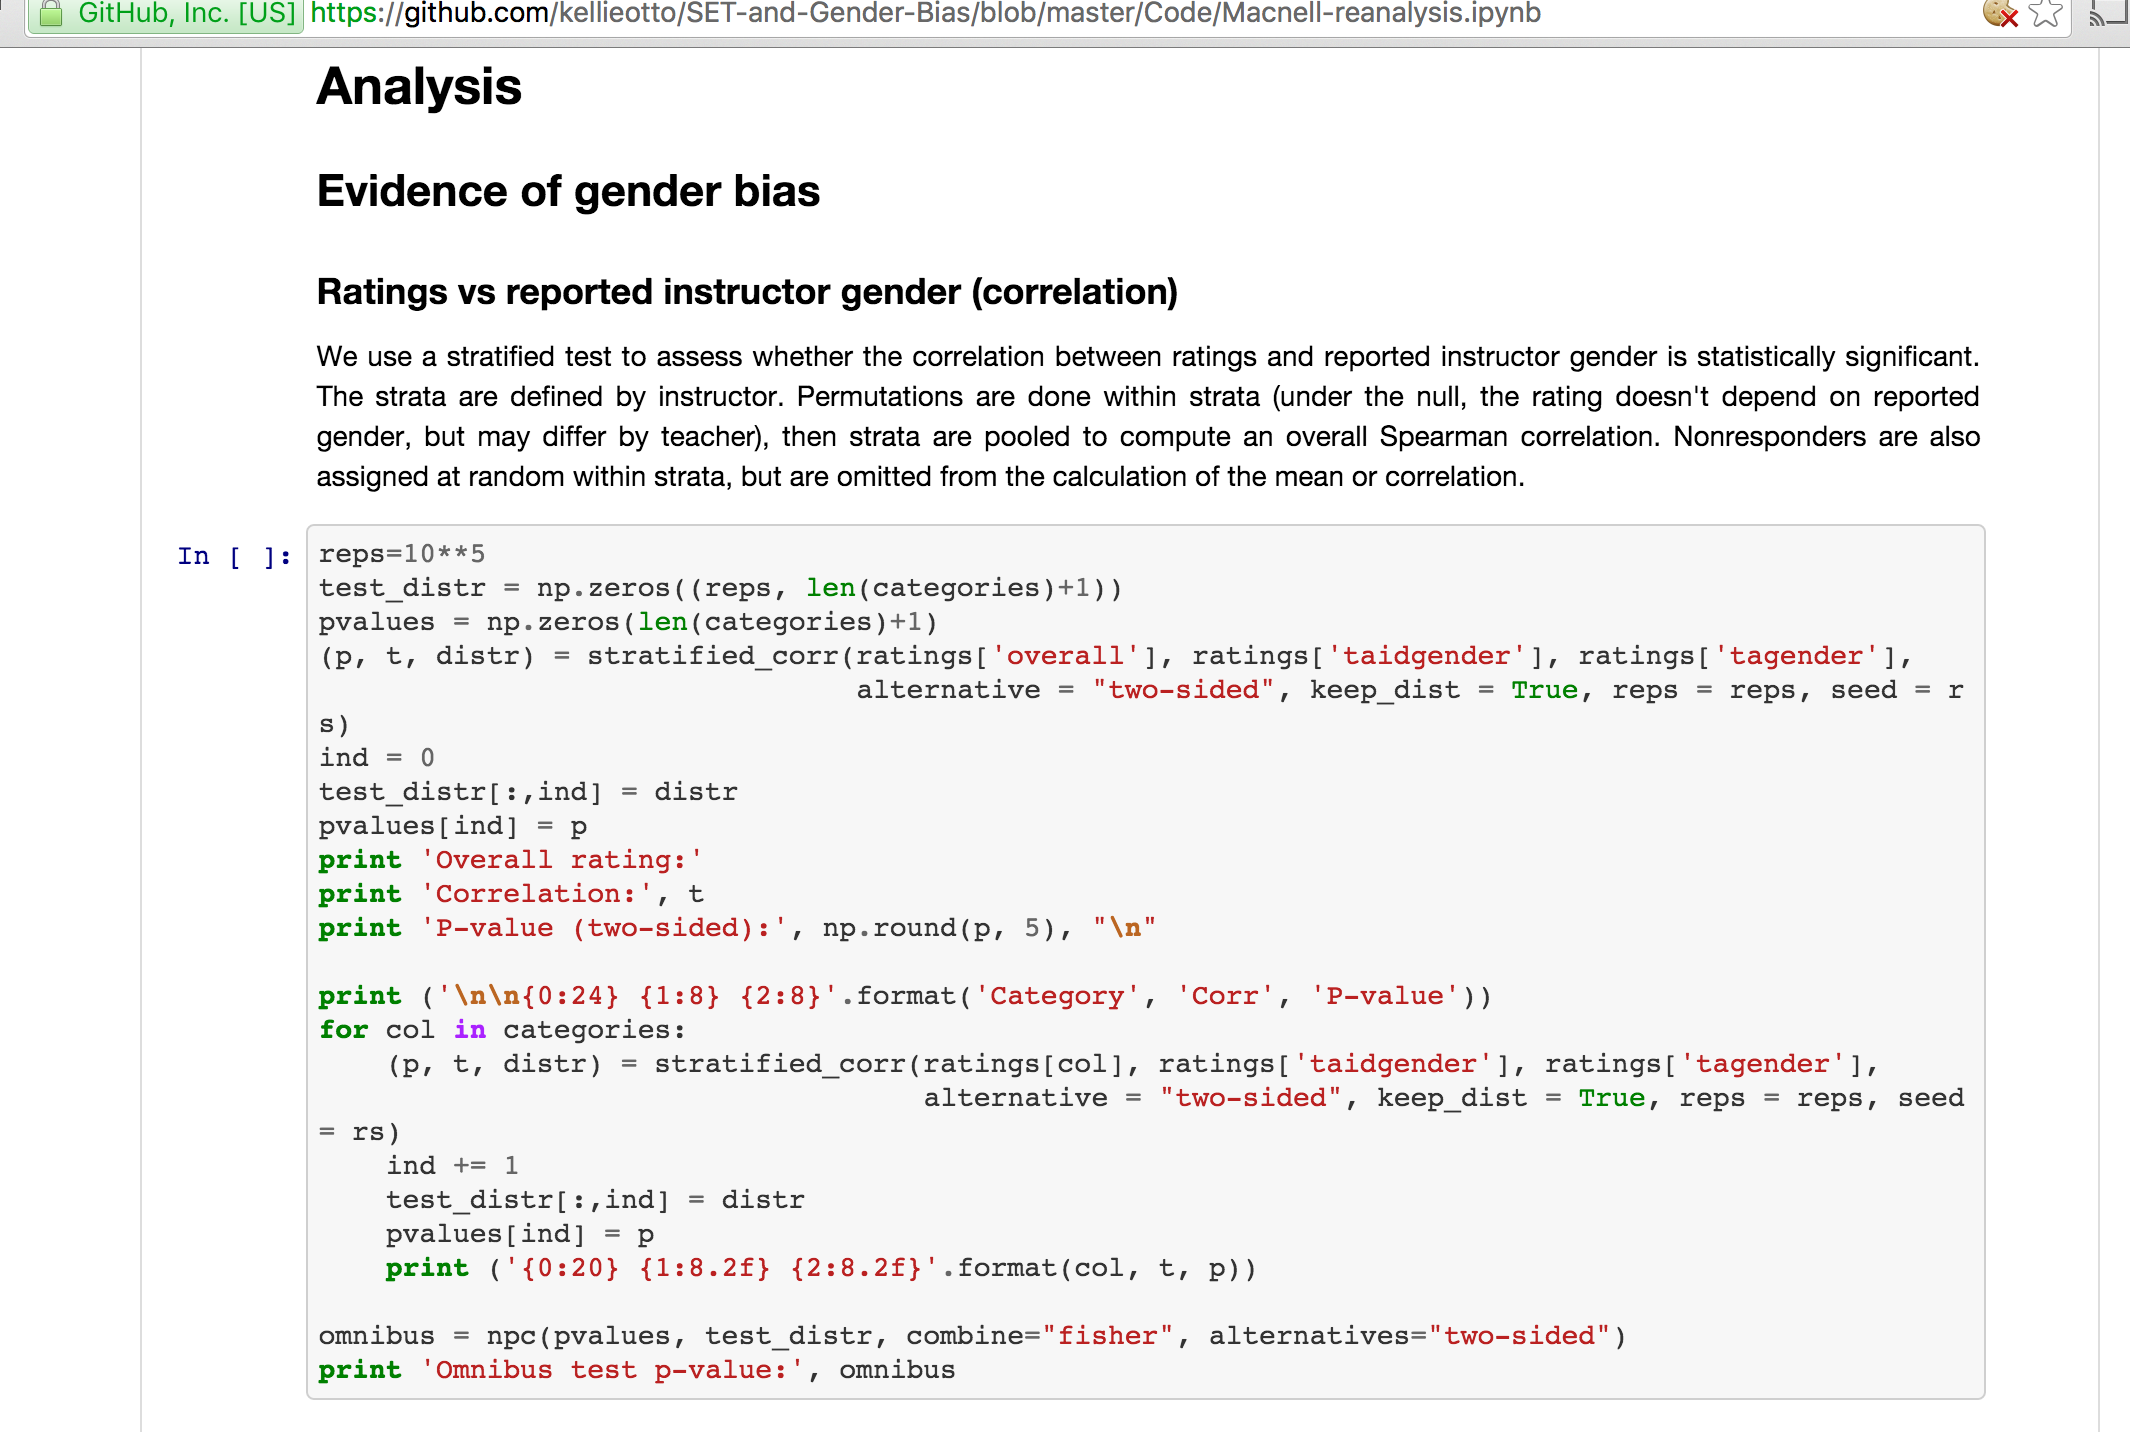 Python code for all analyses is available as [Jupyter](http://jupyter.org) notebook on [GitHub](https://github.com) at https://github.com/kellieotto/SET-and-Gender-Bias Analysis is in an open language in an open scientific notebook format, relies on open _permute_ library) These slides in Markdown and MathJax using remark.js All files are ASCII. --- Papers are in [ScienceOpen](https://www.scienceopen.com) https://www.scienceopen.com/document/vid/818d8ec0-5908-47d8-86b4-5dc38f04b23e (open, post-publication non-anonymous review)