- No amount of computation or theory can compensate for bad study design--but it can hide the issues by changing the subject.
- To answer real-world scientific questions, critical thinking and subject-matter knowledge are more important than mathematical, statistical, or computational technique.
The Rabbit Axioms
For the number of rabbits in a closed system to increase, the system must contain at least two rabbits.
No negative rabbits.
Freedman's Rabbit-Hat Theorem
You cannot pull a rabbit from a hat unless at least one rabbit has previously been placed in the hat.
Corollary
You cannot "borrow" a rabbit from an empty hat, even with a binding promise to return the rabbit later.
Applications of the Rabbit-Hat Theorem
- Can't draw causal conclusions from observational data without assuming the relationship is causal.
- Can't turn a rate into a probability without assuming the phenomenon is random.
- Can't conclude that a process is random without making assumptions that amount to assuming that the process is random.
- Testing whether the process appears to be random using the assumption that it is random cannot prove that it is random. (You can't borrow a rabbit from an empty hat.)
Naturally, there is a strong desire to substitute intellectual capital for labor. That is why investigators often try to base causal inference on statistical models. With this approach, P-values play a crucial role. The technology is relatively easy to use and promises to open a wide variety of questions to the research effort. However, the appearance of methodological rigor can be deceptive. Like confidence intervals, P-values generally deal with the problem of sampling error not the problem of bias. Even with sampling error, artifactual results are likely if there is any kind of search over possible specifications for a model, or different definitions of exposure and disease. Models may be used in efforts to adjust for confounding and other sources of bias, but many somewhat arbitrary choices are made. Which variables to enter in the equation? What functional form to use? What assumptions to make about error terms? These choices are seldom dictated either by data or prior scientific knowledge. That is why judgment is so critical, the opportunity for error so large and the number of successful applications so limited.
-- David A. Freedman, 1999
If we are uncritical we shall always find what we want: we shall look for, and find, confirmations, and we shall look away from, and not see, whatever might be dangerous to our pet theories. In this way it is only too easy to obtain what appears to be overwhelming evidence in favor of a theory which, if approached critically, would have been refuted.
-- Karl Popper
Types of problems
Curve fitting, data summary
Clustering, classification
Exploratory data analysis, thought experiments
Estimation & inference in a known model
Prediction
Causal inference
Role of models
Compact description of the data
Predict future data
Predict the effect of an intervention--requires "physics"
- curves versus response schedules
Types of models
Parametric: functional form explicit
Nonparametric: no functional form or implicit functional form
ANNs, trees, forests, etc.: flexible classes of functions
What is ML?
Collection of models
Algorithms for fitting those models to various kinds/sizes of data
Folklore about how to select models/features
Domain-specific knowledge
Domain-specific hacks
- Not magic: something has to put a rabbit in the hat.
Fallacies do not cease to be fallacies because they become fashions.
-- G.K. Chesterton
When is a probability not a probability?
Usually.
Example: Logistic Regression
$$ \ln \frac{p}{1-p} = X \beta.$$
Commonly used to model binary responses & for classification.
What justifies modeling the response as random?
Rates versus probabilities
- In a series of trials, if each trial has the same probability $p$ of success, and if the trials are independent, then the rate of successes converges (in probability) to $p$. Law of Large Numbers
- If a finite series of trials has an empirical rate $p$ of success, that says nothing about whether the trials are random.
- If the trials are random and have the same chance of success, the empirical rate is an estimate of the chance of success.
- If the trials are random and have the same chance of success and the dependence of the trials is known (e.g., the trials are independent), can quantify the uncertainty of the estimate.
Thought experiments
You are one of a group of 100 people. You learn that one will die in the next year.
What's the chance it's you?
You are one of a group of 100 people. You learn that one is named "Philip."
What's the chance it's you?
What is Probability?
- Kolmogorov's axioms:
- "just math"
- triple $ (S, \Omega, P)$
- $S$ a set
- $\Omega$ a sigma-algebra on $S$
- $P$ a non-negative countably additive measure with total mass 1
- Philosophical theory that ties the math to the world
- What does probability mean?
- Standard theories
- Equally likely outcomes
- Frequency theory
- Subjective theory
- Probability models as empirical commitments
- Probability as metaphor
How does probability enter a scientific problem?
underlying phenomenon is random (quantum physics)
deliberate randomization (randomized experiments, random sampling)
subjective probability
- no posteriors without priors
- prior generally matters
- elicitation
- arguments from consistency, "Dutch book," ...
- why should I care about your subjective probability
model that's supposed to describe the phenomenon
- in what sense?
- to what level of accuracy?
- description v. prediction v. predicting effect of intervention
- testable to desired level of accuracy?
metaphor: phenomenon behaves "as if random"
Two very different situations:
Scientist creates randomness by taking a random sample, assigning subjects at random to treatment or control, etc.
Scientist invents (assumes) a probability model for data the world gives.
(1) allows sound inferences.
(2) is often "garbage in, garbage out."
Gotta check the assumptions
Empirical support?
Plausible?
Iffy?
Absurd?
Making sense of probabilities in applied problems is hard
"Probability" often invoked without thinking
Reflexive way to try to represent uncertainty
Not all uncertainty can be represented by a probability
"Aleatory" versus "Epistemic"
Aleatory
- Canonical examples: coin toss, die roll, lotto, roulette
- under some circumstances, behave "as if" random (but not perfectly)
Epistemic: stuff we don't know
Bayesian way to combine aleatory & epistemic uncertainty puts beliefs on a par with an unbiased physical measurement w/ known uncertainty.
Claims by introspection, can estimate without bias, with known accuracy, just as if one's brain were unbiased instrument with known accuracy
Bacon's triumph over Aristotle should put this to rest, but empirically:
- people are bad at making even rough quantitative estimates
- quantitative estimates usually biased
- bias from anchoring, priming, etc.
- people are bad at judging weights in their hands: bias from shape & density
- people are bad at judging when something is random
- people are overconfident in their estimates and predictions
- confidence unconnected to actual accuracy.
- anchoring affects entire disciplines (e.g., Millikan, c, Fe in spinach)
- what if I don't trust your internal scale, or your assessment of its accuracy?
- same observations that are factored in as "data" are also used to form beliefs: "measurements" made by introspection are not independent of the data
- if you try several priors, you are not using Bayesian statistics
Bayesian and Frequentist Uncertainties
What varies?
What is constant (conditioned on)?
How do we know how the variable varies?
Are we talking about our world, or a set of possible worlds?
Bayesian estimates
General approach (viz, don't even need data to make an estimate)
Guaranteed to have some good frequentist properties (if prior is proper and model dimension is finite)
Can be thought of as a kind of regularization
Elegant math from perspective of decision theory: convexify strategy space
Bayesian uncertainty estimates
Utterly different interpretation than frequentist uncertainties
- Frequentist: hold parameter constant, characterize behavior under repeated measurement
- Bayesian: hold measurement constant, characterize behavior under repeatedly drawing parameter at random from the prior
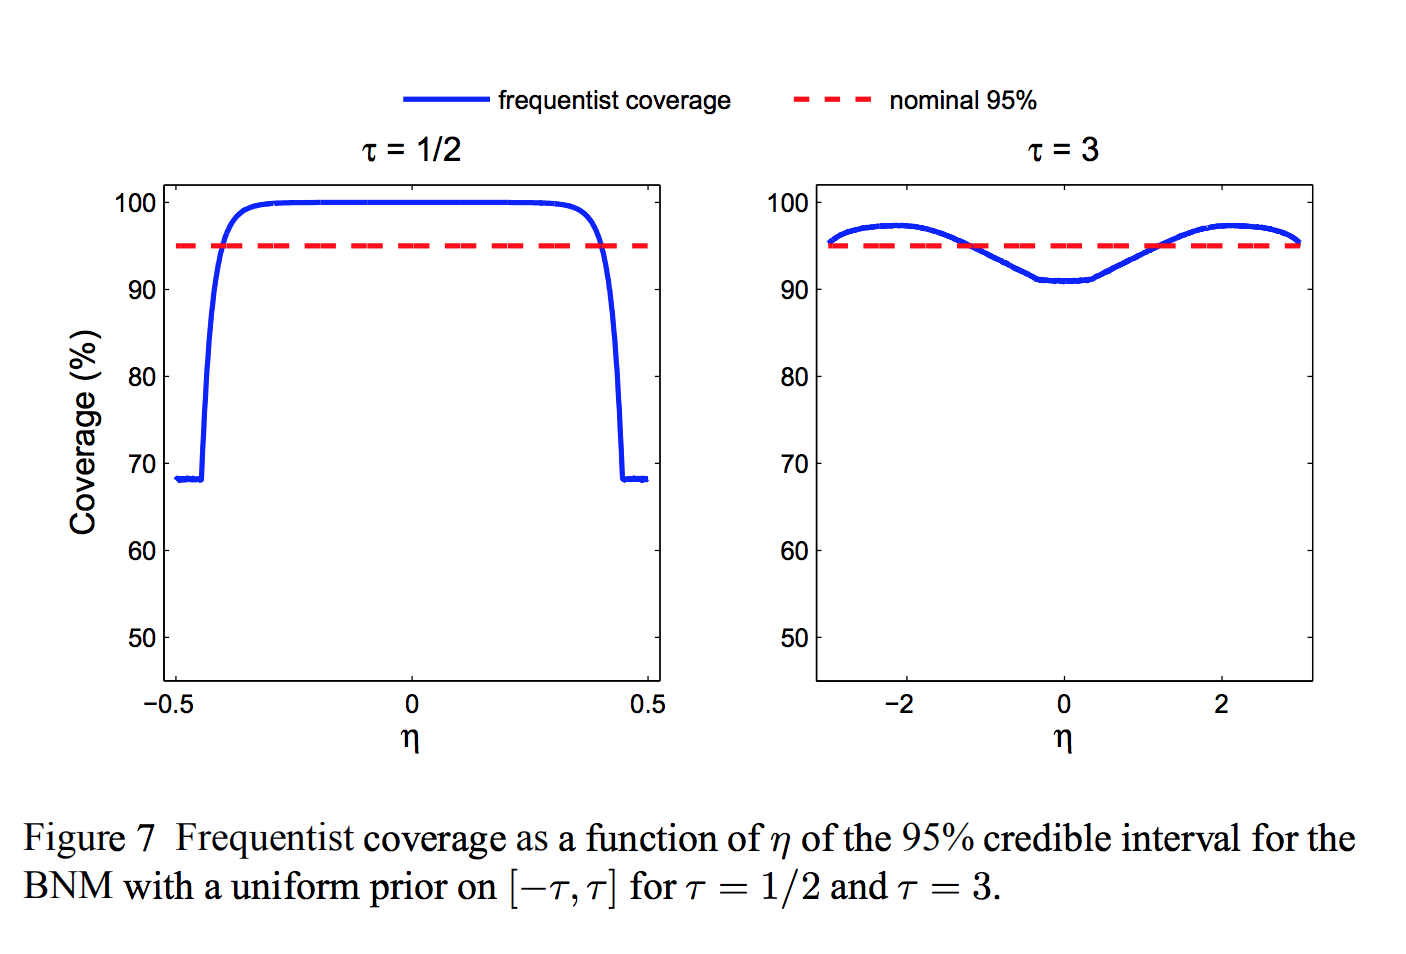
Credible regions versus confidence regions
- credible level: probability that by drawing from prior, nature generates an element of the set, given the data
- confidence level: probability that procedure gives a set that contains the truth
- incommensurable!
- Can grade Bayesian methods using frequentist criteria
- E.g., what is the coverage probability of a credible region?
Toy problem: bounded normal mean
Observe $Y \sim N(\theta, 1)$.
Know a priori that $\theta \in [-\tau, \tau]$
Bayes "uninformative" prior: $\theta \sim U[-\tau, \tau]$
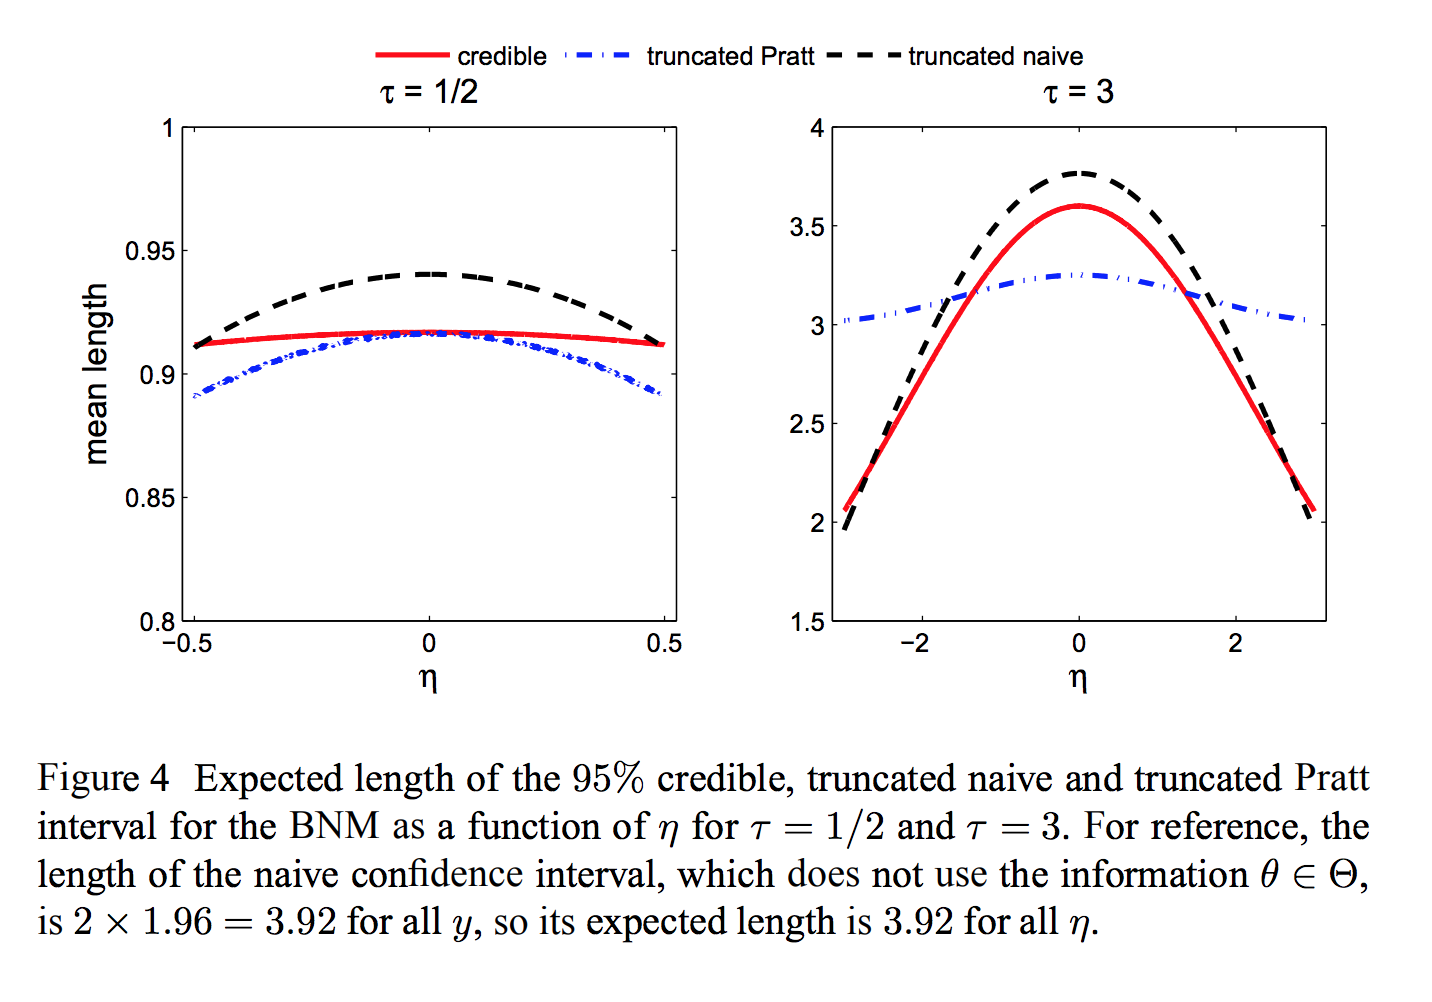
Duality between Bayes and minimax approaches
- Formal Bayesian uncertainty can be made as small as desired by choosing prior appropriately.
- Under suitable conditions, the minimax frequentist risk is equal to the Bayes risk for the "least-favorable" prior.
- If Bayes risk is less than minimax risk, prior is artificially reducing the (apparent) uncertainty. Regardless, means something different.
- Least-favorable prior can be approximated numerically even for "black-box" numerical models, a la Schafer & Stark (2009)
Posterior uncertainty measures meaningful only if you believe prior
Changes the subject
Is the truth unknown? Is it a realization of a known probability distribution?
Where does prior come from?
Usually chosen for computational convenience or habit, not "physics"
Priors get their own literature
Eliciting priors problematic
Why should I care about your posterior, if I don't share your prior?
How much does prior matter?
Slogan "the data swamp the prior." Theorem has conditions that aren't always met.
—George Box
Commonly ignored sources of uncertainty:
Coding errors (ex: Hubble)
Stability of optimization algorithms (ex: GONG)
"upstream" data reduction steps
Quality of PRNGs
| Expression | full | scientific notation |
|---|---|---|
| $2^{32}$ | 4,294,967,296 | 4.29e9 |
| $2^{64}$ | 18,446,744,073,709,551,616 | 1.84e19 |
| $2^{128}$ | 3.40e38 | |
| $2^{32 \times 624}$ | 9.27e6010 | |
| $13!$ | 6,227,020,800 | 6.23e9 |
| $21!$ | 51,090,942,171,709,440,000 | 5.11e19 |
| $35!$ | 1.03e40 | |
| $2084!$ | 3.73e6013 | |
| ${50 \choose 10}$ | 10,272,278,170 | 1.03e10 |
| ${100 \choose 10}$ | 17,310,309,456,440 | 1.73e13 |
| ${500 \choose 10}$ | 2.4581e20 | |
| $\frac{2^{32}}{{50 \choose 10}}$ | 0.418 | |
| $\frac{2^{64}}{{500 \choose 10}}$ | 0.075 | |
| $\frac{2^{32}}{7000!}$ | $<$ 1e-54,958 | |
| $\frac{2}{52!}$ | 2.48e-68 |
Cargo Cult Confidence Intervals
Have a collection of numbers, e.g., MME climate model predictions of warming
Take mean and standard deviation.
Report mean as the estimate; construct a confidence interval or "probability" statement from the results, generally using Gaussian critical values
IPCC does this
No random sample; no stochastic errors.
Even if there were a random sample, what justifies using normal theory?
Even if random and normal, misinterprets confidence as probability. Garbled; something like Fisher's fiducial inference
Ultimately, quantifauxcation.
Random versus haphazard/unpredictable
Consider taking a sample of soup to tell whether it is too salty.
- Stirring the soup, then taking a tablespoon, gives a random sample
- Sticking in a tablespoon without looking gives a haphazard sample
Tendency to treat haphazard as random
- random requires deliberate, precise action
- haphazard is sloppy
Probability, p-value, confidence intervals, etc., apply only if the sample is random (or for some kinds of measurement errors)
Do not apply to samples of convenience, haphazard samples, etc.
Do not apply to populations.
Do Monte Carlo simulations estimate real-world probabilities?
Monte Carlo is a way to substitute computing for calculation.
Does not reveal anything that was not already an assumption in the calculation.
Distribution of the output results from the assumptions in the input.
The randomness is an assumption, not a conclusion; the distribution is an assumption, not a conclusion.
Sketch examples
Avian / wind-turbine interactions
Earthquake probabilities
Climate models and climate change probabilities
Wind power: "avian / wind-turbine interactions"

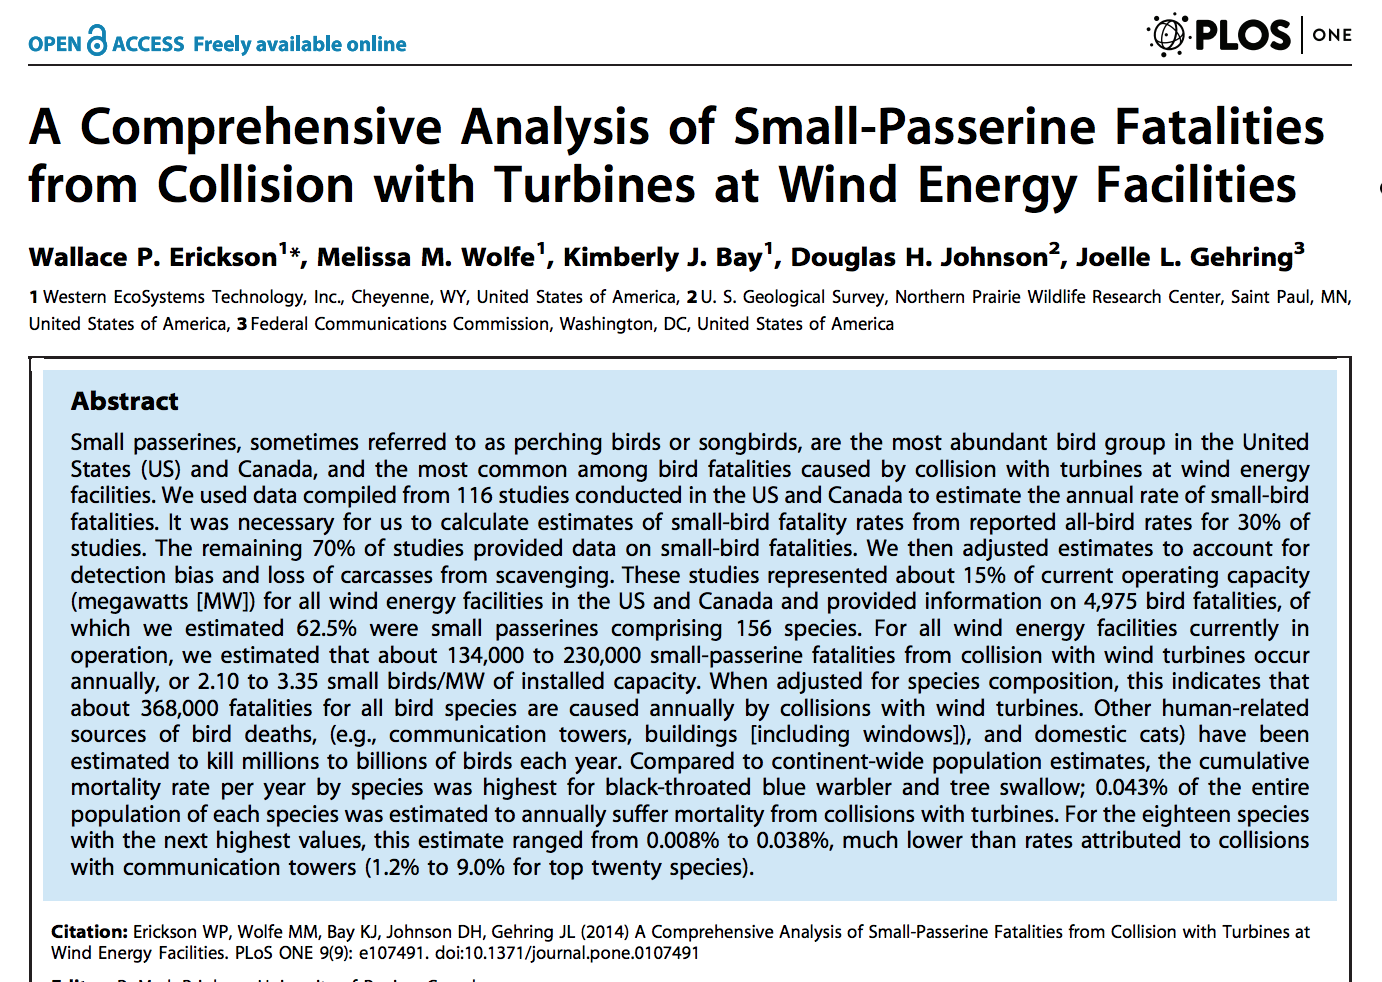
Wind turbines kill birds, including raptors.
how many, and of what species?
how concerned should we be?
what design and siting features matter?
how do you build/site less lethal turbines?
Measurements
Periodic on-the-ground surveys, subject to:
censoring
shrinkage/scavenging
background mortality
pieces of two birds, or two pieces of one bird?
how far from the point of injury does a bird land? attribution...
Is it possible to ...
make an unbiased estimate of mortality?
reliably relate the mortality to individual turbines in wind farms?
Stochastic model
Common: Mixture of a point mass at zero and some distribution on the positive axis. E.g., "Zero-inflated Poisson"
Countless alternatives, e.g.:
observe $\max\{0, \mbox{Poisson}(\lambda_j)-b_j\}$, $b_j > 0$
observe $b_j\times \mbox{Poisson}(\lambda_j)$, $b_j \in (0, 1)$.
observe true count in area $j$ with error $\epsilon_j$, where $\{\epsilon_j\}$ are dependent, not identically distributed, nonzero mean
Consultant
- bird collisions random, Poisson distributed
- same distribution for all birds
- independent across birds
- rates follow hierarchical Bayesian model that depends on covariates: properties of site and turbine design
What does this mean?
- when a bird approaches a turbine, it tosses a coin to decide whether to throw itself on the blades
- chance of heads depends on site and turbine design
- all birds use same coin for each site/design
- birds toss coins independently
Changes the question from bird deaths to the chance of heads for hypothetical coins.
Where do the models come from?
Why random?
Why Poisson?
Why independent from site to site? From period to period? From bird to bird? From encounter to encounter?
Why doesn't chance of detection depend on size, coloration, groundcover, …?
Why do different observers miss carcasses at the same rate?
What about background mortality?
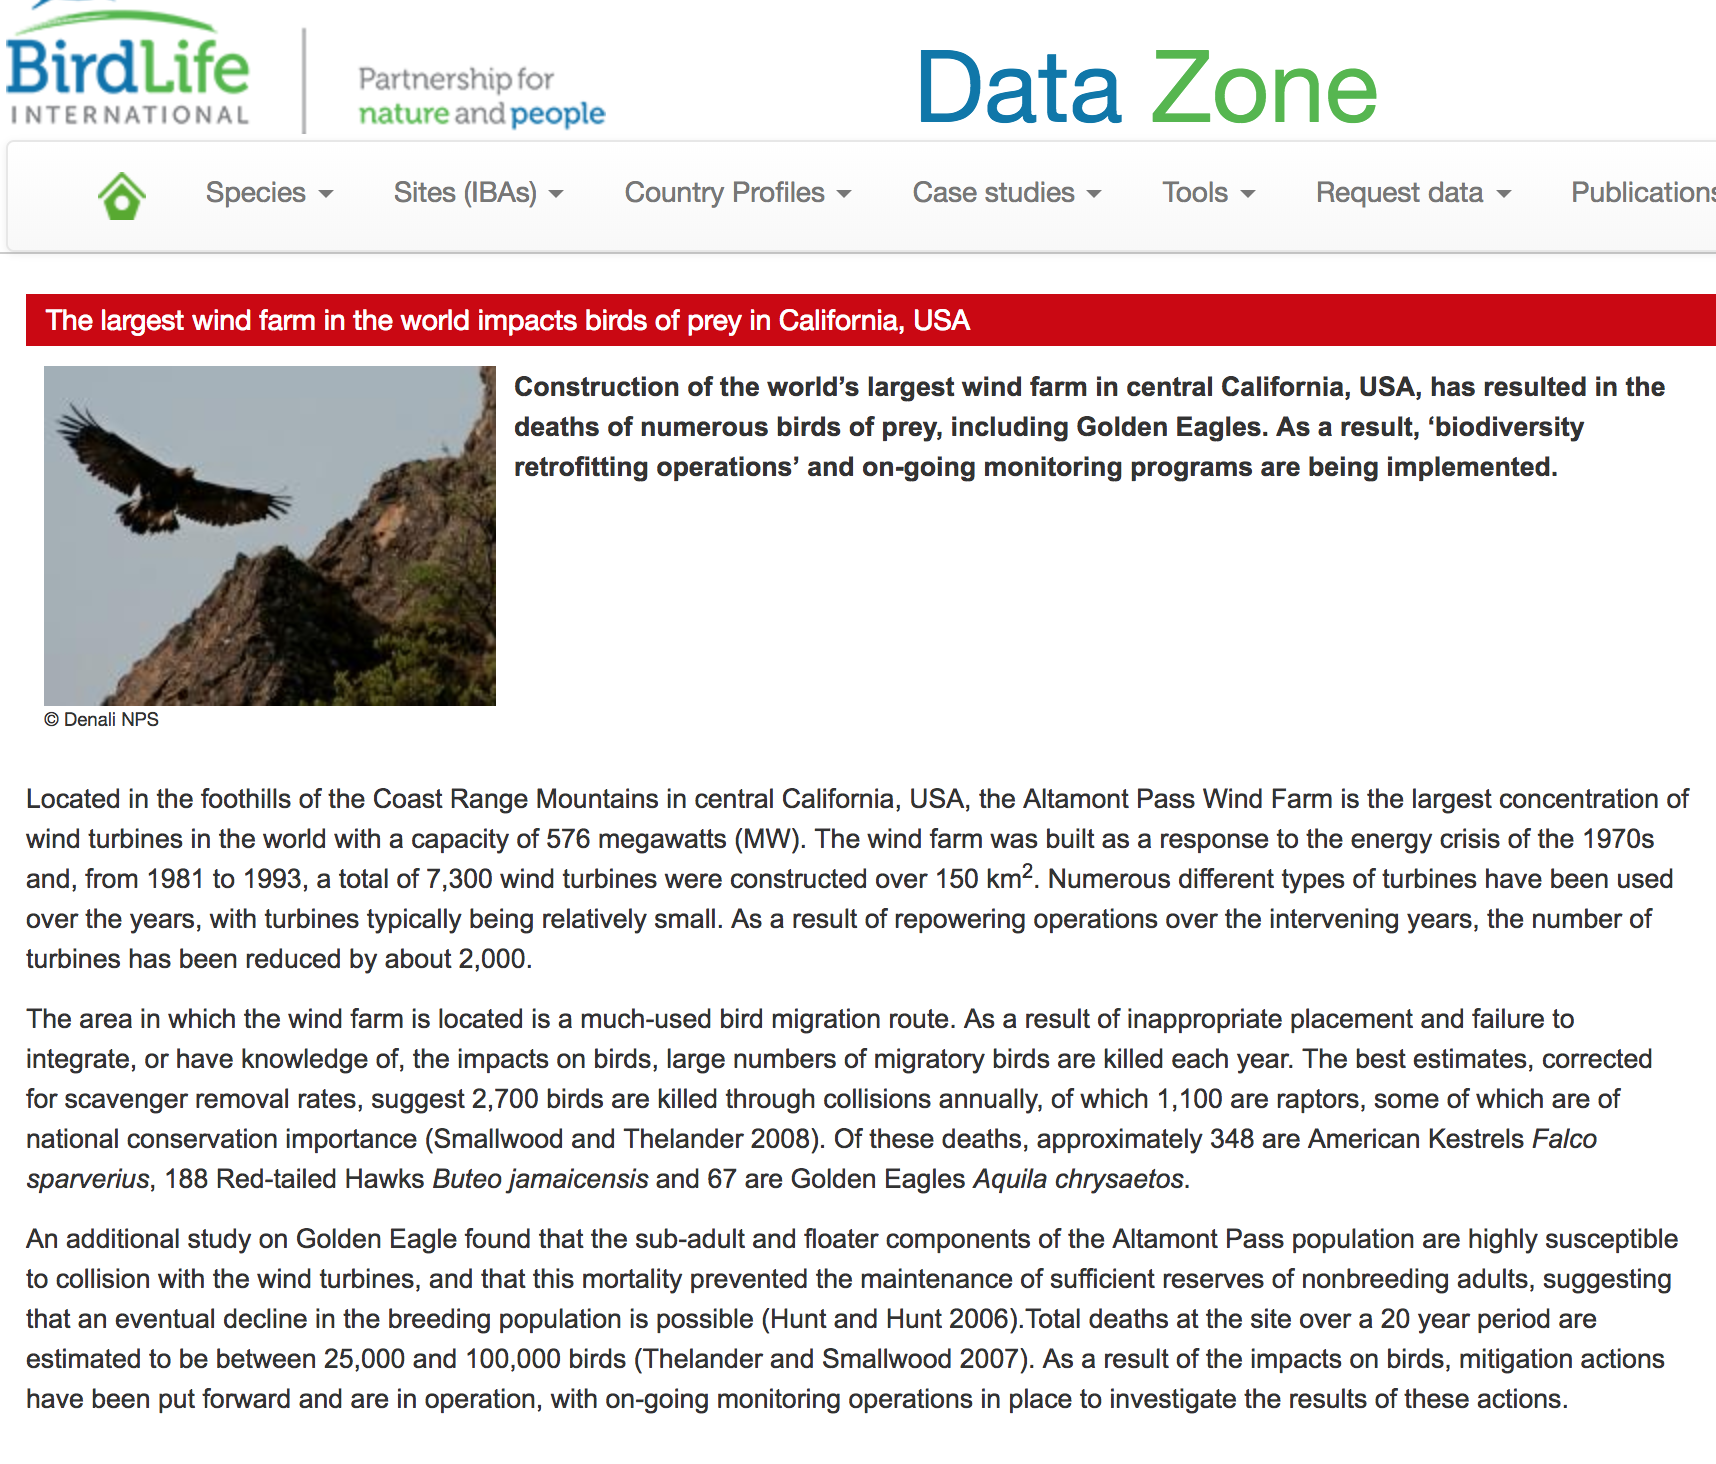
Complications at Altamont
- Why is randomness a good model?
- Why is Poisson in particular reasonable?
- Do birds in effect toss coins, independently, with same chance of heads, every encounter with a turbine?
- Is #encounters $\times P(\mbox{heads})$ constant?
- Why estimate parameters in contrived model instead of actual mortality?
- Do we want to know how many birds die, or the value of $\lambda$ in an implausible stochastic model?
- Background mortality—varies by time, species, etc.
- Are all birds equally likely to be missed? Smaller more likely than larger? Does coloration matter?
- Nonstationarity (seasonal effects—migration, nesting, etc.; weather; variations in bird populations)
- Spatial and seasonal variation in shrinkage due to groundcover, coloration, illumination, etc.
- Interactions and dependence.
- Variations in scavenging. (Dependence on kill rates? Satiation? Food preferences? Groundcover?)
- Birds killed earlier in the monitoring interval have longer time on trial for scavengers.
- Differences or absolute numbers? (Often easier to estimate differences accurately.)
- Same-site comparisons across time, or comparisons across sites?
Earthquake probabilities
Probabilistic seismic hazard analysis (PSHA): basis for building codes in many countries & for siting nuclear power plants
Models locations & magnitudes of earthquakes as random; mags iid
Models ground motion as random, given event. Distribution depends on the location and magnitude of the event.
Claim to estimate "exceedance probabilities": chance acceleration exceeds some threshold in some number of years
In U.S.A., codes generally require design to withstand accelerations w probability ≥2% in 50y.
PSHA arose from probabilistic risk assessment (PRA) in aerospace and nuclear power.
Those are engineered systems whose inner workings are known but for some system parameters and inputs.Inner workings of earthquakes are almost entirely unknown: PSHA is based on metaphors and heuristics, not physics.
Some assumptions are at best weakly supported by evidence; some are contradicted.
 |
|
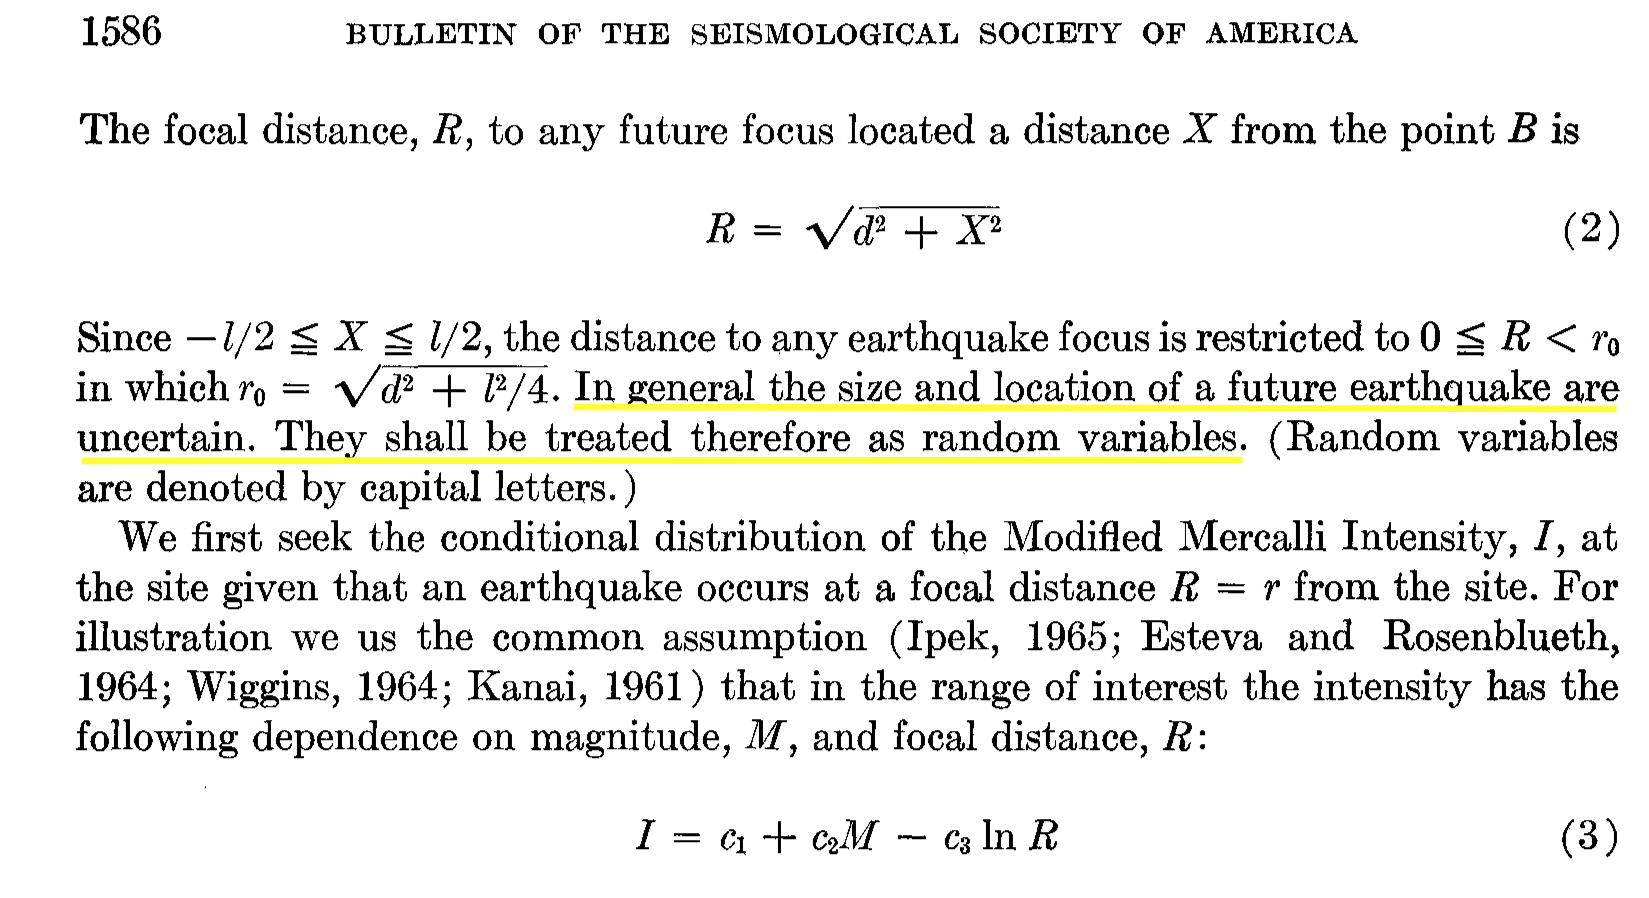
The PSHA equation
Model earthquake occurrence as a marked stochastic process with known parameters.
Model ground motion in a given place as a stochastic process, given the quake location and magnitude.
Then,
probability of a given level of ground movement in a given place is the integral (over space and magnitude) of the conditional probability of that level of movement given that there's an event of a particular magnitude in a particular place, times the probability that there's an event of a particular magnitude in that place
That earthquakes occur at random is an assumption not based in theory or observation.
involves taking rates as probabilities
- Standard argument:
- M = 8 events happen about once a century.
- Therefore, the chance is about 1% per year.
- Standard argument:
Earthquake casinos
Models amount to saying there's an "earthquake deck"
Turn over one card per period. If the card has a number, that's the size quake you get.
Journals full of arguments about how many "8"s in the deck, whether the deck is fully shuffled, whether cards are replaced and re-shuffled after dealing, etc.
- just a metaphor!
Earthquake terrorism
Why not say earthquakes are like terrorist bombings?
- don't know where or when
- know they will be large enough to kill
- know some places are "likely targets"
- but no probabilities
What advantage is there to the casino metaphor?
What would make the casino metaphor apt?
- the physics of earthquakes might be stochastic. But it isn't.
- stochastic models might provide a compact, accurate description of earthquake phenomenology. But it doesn't.
- stochastic models might be useful for predicting future seismicity. But it isn't (Poisson, Gamma renewal, ETAS)
3 of the most destructive recent earthquakes were in regions seismic hazard maps showed to be relatively safe (2008 Wenchuan M7.9, 2010 Haiti M7.1, & 2011 Tohoku M9) Stein, Geller, & Liu, 2012
What good are the numbers?
Climate models
IPCC Cross-Working Group Meeting on Consistent Treatment of Uncertainties, 2010
https://www.ipcc.ch/pdf/supporting-material/uncertainty-guidance-note.pdf (at p.2)
… quantified measures of uncertainty in a finding expressed probabilistically (based on statistical analysis of observations or model results, or expert judgment).
… Depending on the nature of the evidence evaluated, teams have the option to quantify the uncertainty in the finding probabilistically. In most cases, author teams will present either a quantified measure of uncertainty or an assigned level of confidence.
… Because risk is a function of probability and consequence, information on the tails of the distribution of outcomes can be especially important. … Author teams are therefore encouraged to provide information on the tails of distributions of key variables …
Cargo-cult confidence common in IPCC work:
As mentioned above
- have a list of numbers, not a sample from anything and certainly not a random sample
- take mean and SD
- treat as if random sample from Normal distribution
- confuse confidence with probability
- garble interpretation, using something like Fisher's fiducial inference
Result is gibberish.
Does "expert judgment" reveal probability?
Recall from above:
- Claims by introspection, can estimate without bias, with known accuracy, just as if one's brain were unbiased instrument with known accuracy.
- Empirically,
- people are bad at making even rough quantitative estimates
- quantitative estimates are usually biased
- bias can be manipulated by anchoring, priming, etc.
- people are bad at judging weights in their hands: biased by shape & density
- people are bad at judging when something is random.
- people are overconfident in their estimates and predictions
- confidence unconnected to actual accuracy.
- anchoring effects entire disciplines (e.g., Millikan, c, Fe in spinach)
- what if I don't trust your internal scale, or your assessment of its accuracy?
- same observations that are factored in as "data" are also used to form beliefs: the "measurements" made by introspection are not independent of the data. (Examples in cosmology, particle physics, ...)
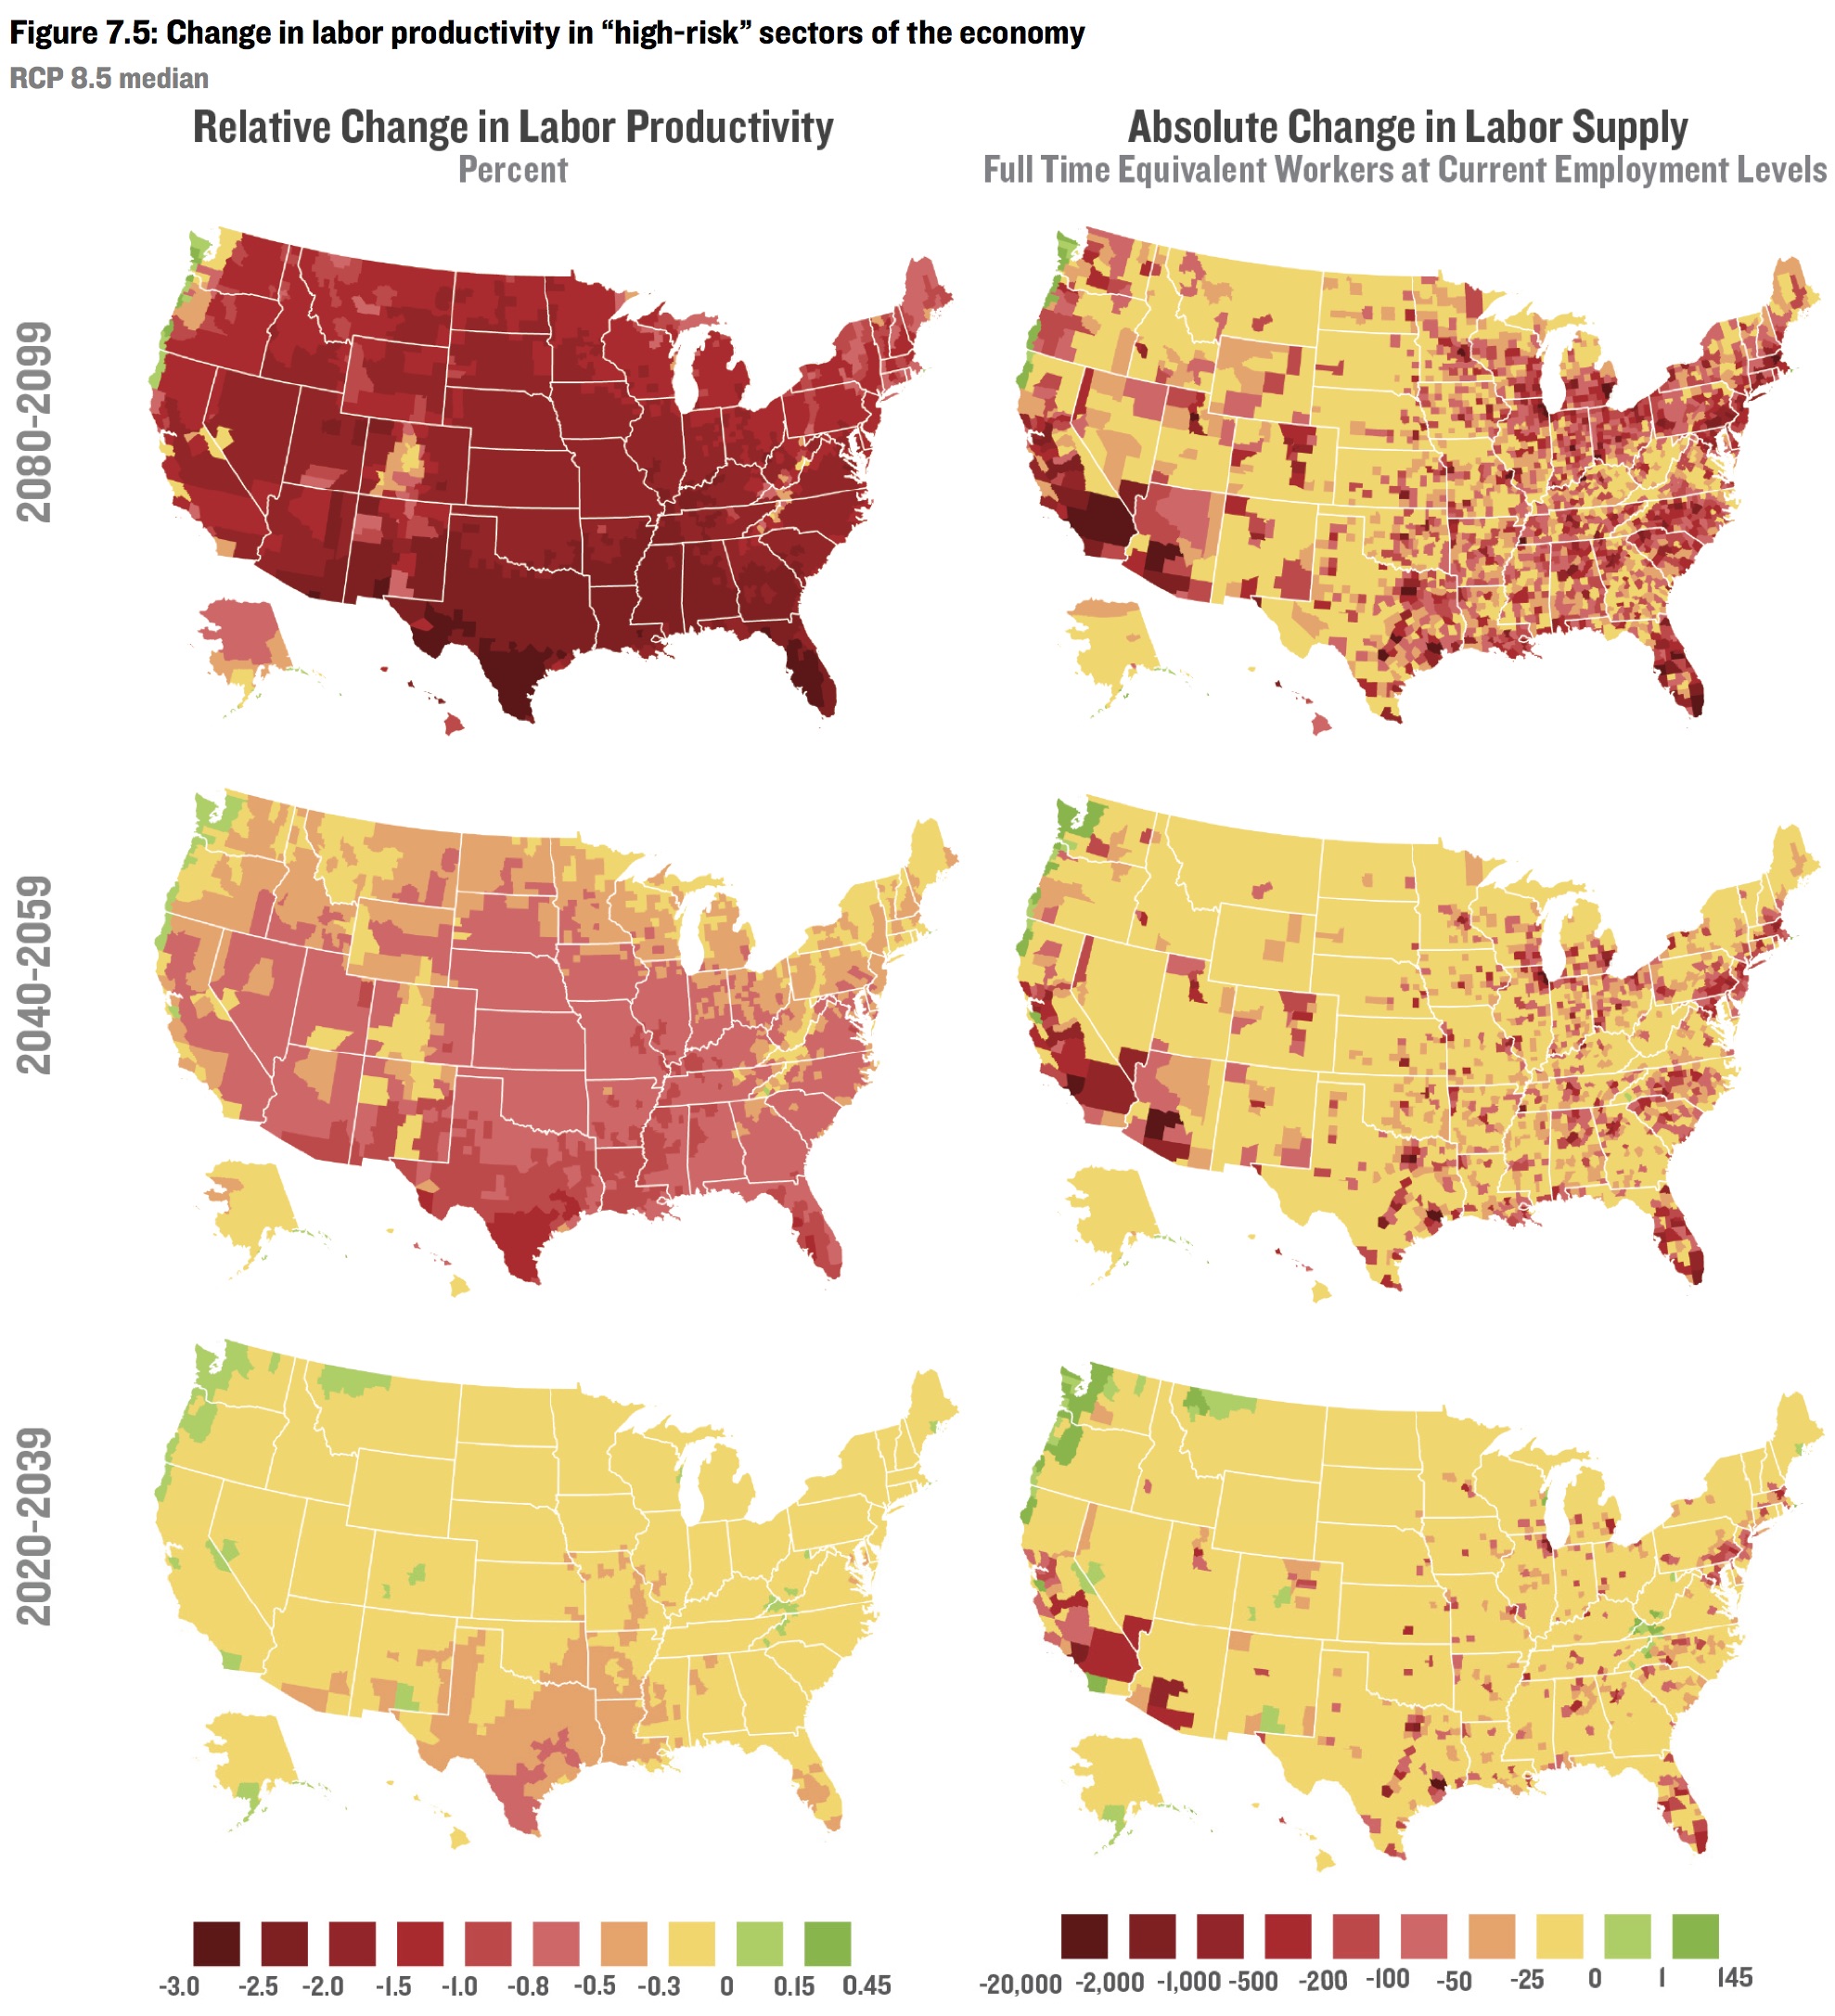
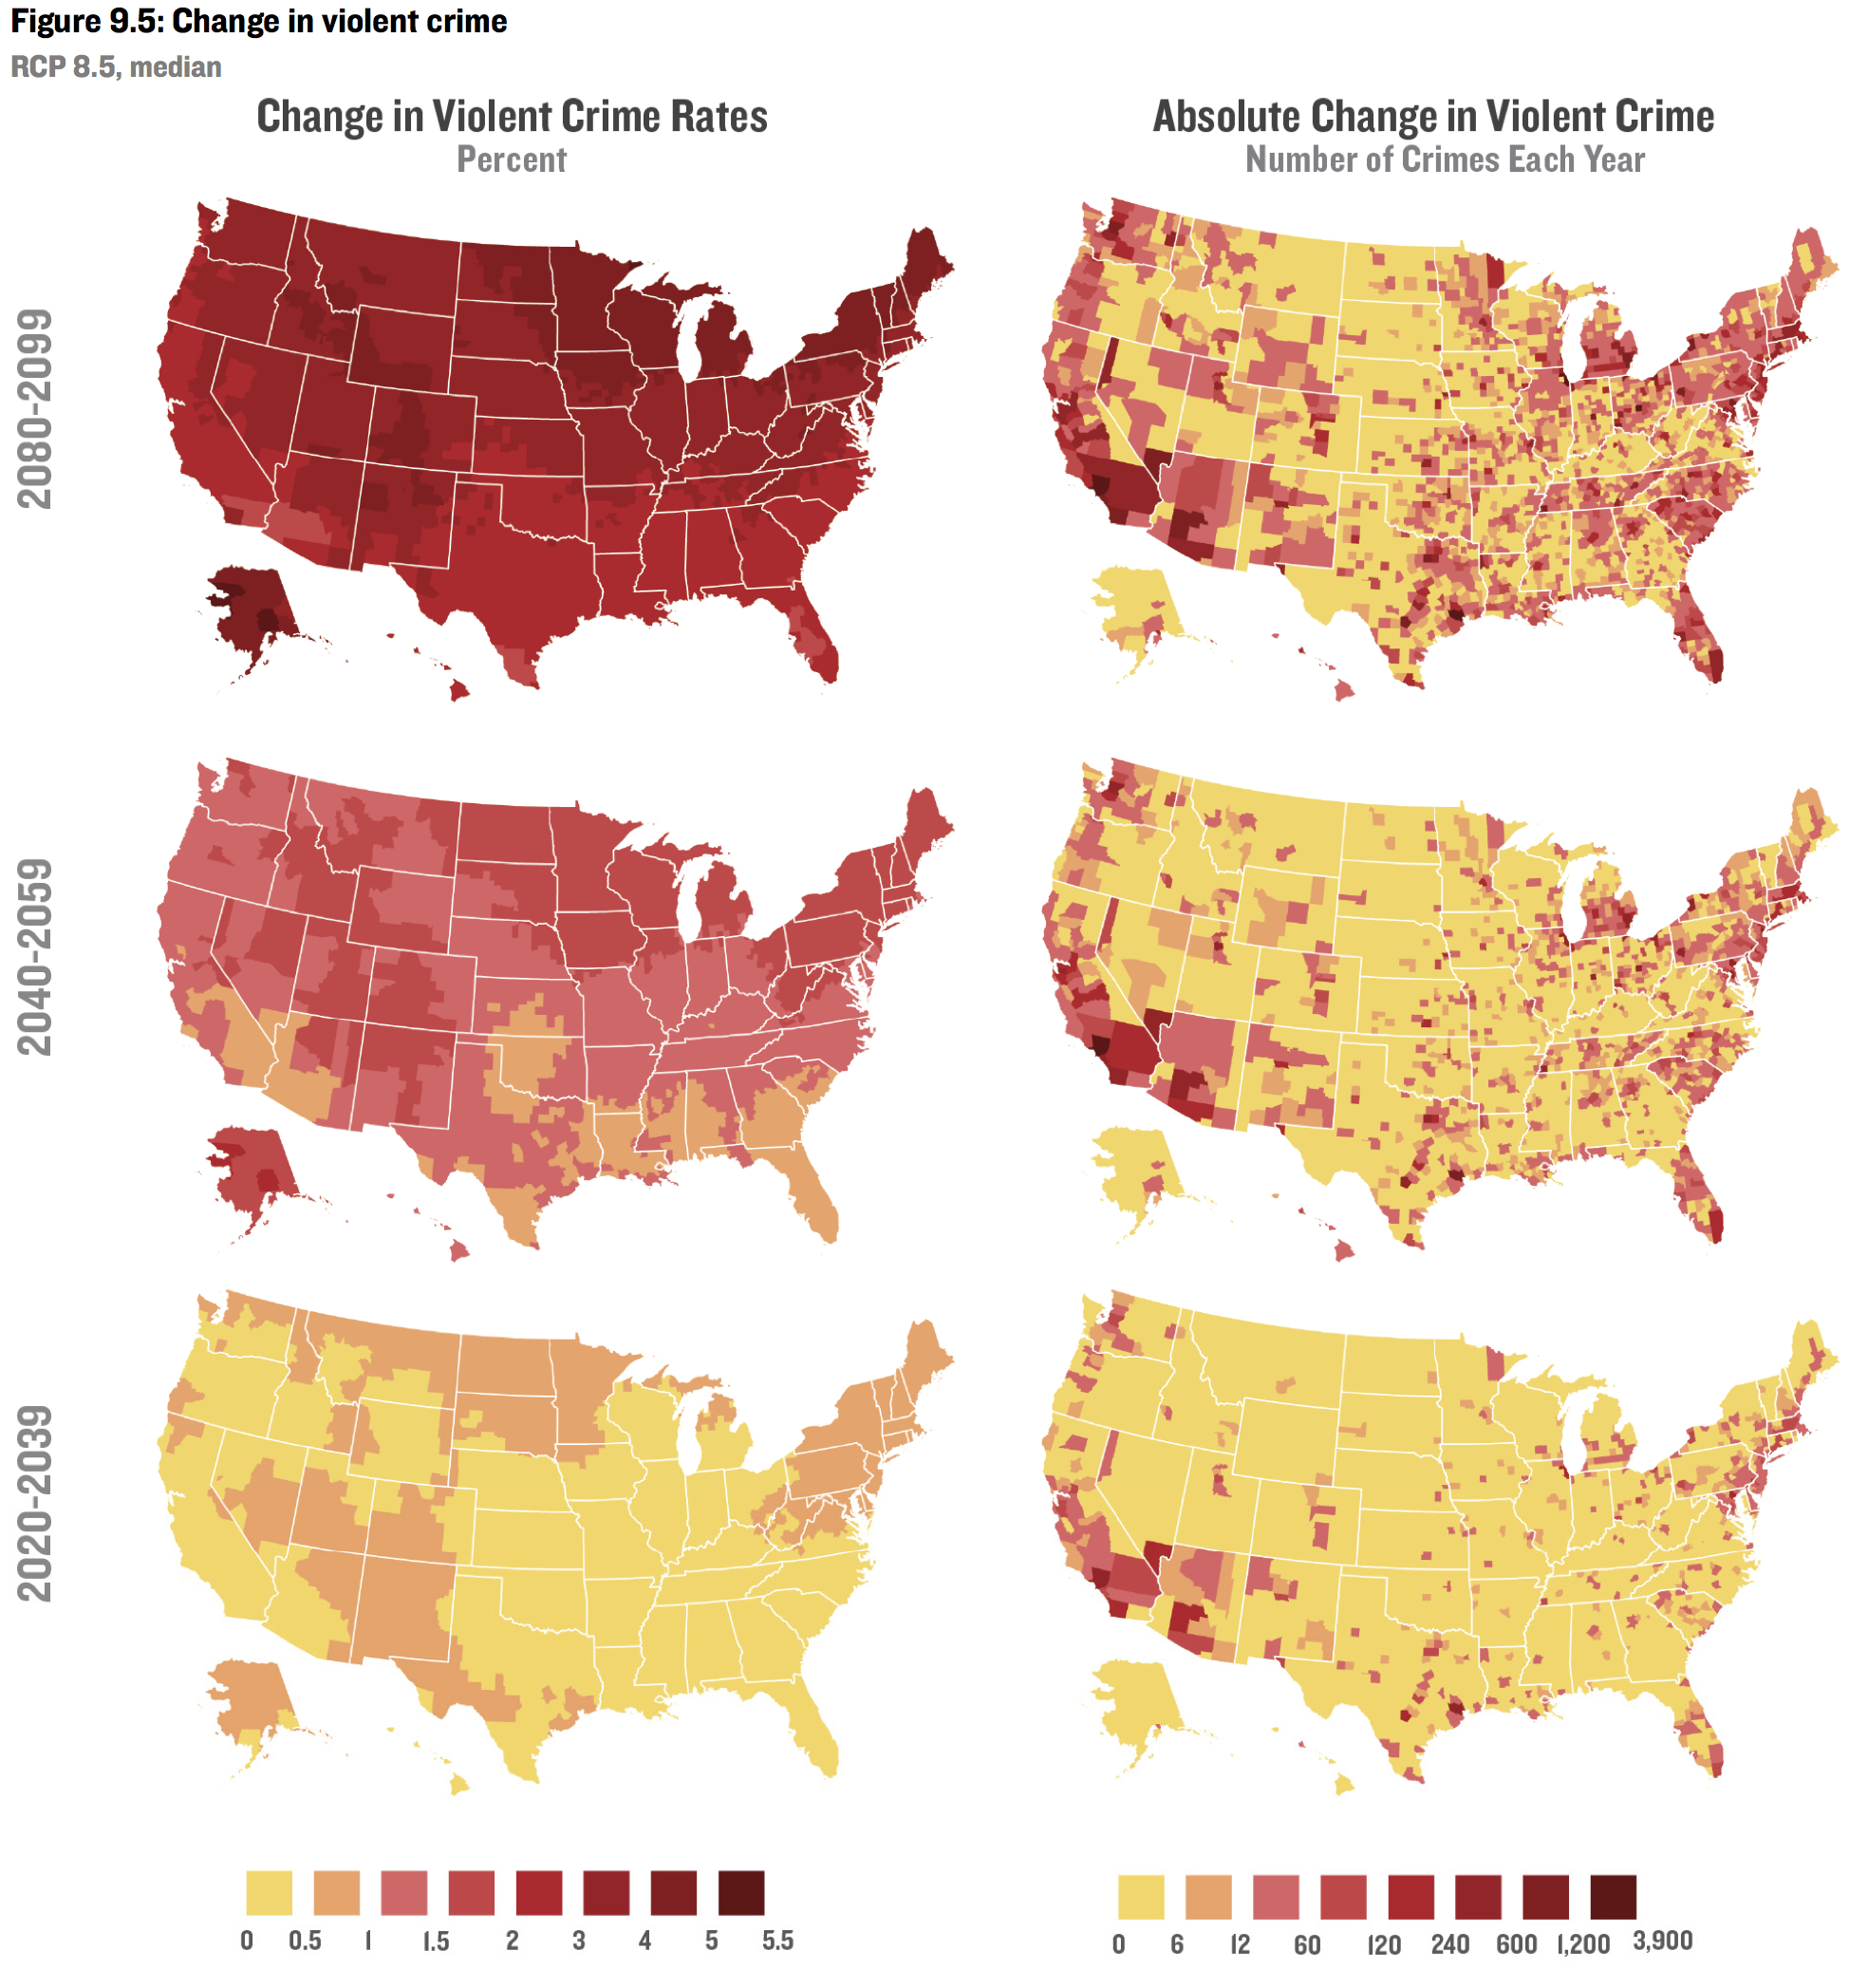
Rhodium Group Climate Prospectus
"Risky Business" project co-chaired by Michael R. Bloomberg, Henry Paulson, Tom Steyer.
Funded by Bloomberg Philanthropies, the Paulson Institute, and TomKat Charitable Trust. Also Skoll Global Threats Fund, Rockefeller Family Fund, McKnight Foundation, Joyce Foundation.
"While our understanding of climate change has improved dramatically in recent years, predicting the severity & timing of future impacts remains a challenge. Uncertainty surrounding the level of GHG emissions going forward & the sensitivity of the climate system to those emissions makes it difficult to know exactly how much warming will occur, & when. Tipping points, beyond which abrupt & irreversible changes to the climate occur, could exist. Due to the complexity of the Earth’s climate system, we do not know exactly how changes in global average temperatures will manifest at a regional level. There is considerable uncertainty about how a given change in temperature, precipitation, or sea level will impact different sectors of the economy, & how these impacts will interact."
yet, …
"In this American Climate Prospectus, we aim to provide decision-makers in business & in government with the facts about the economic risks & opportunities climate change poses in the United States."
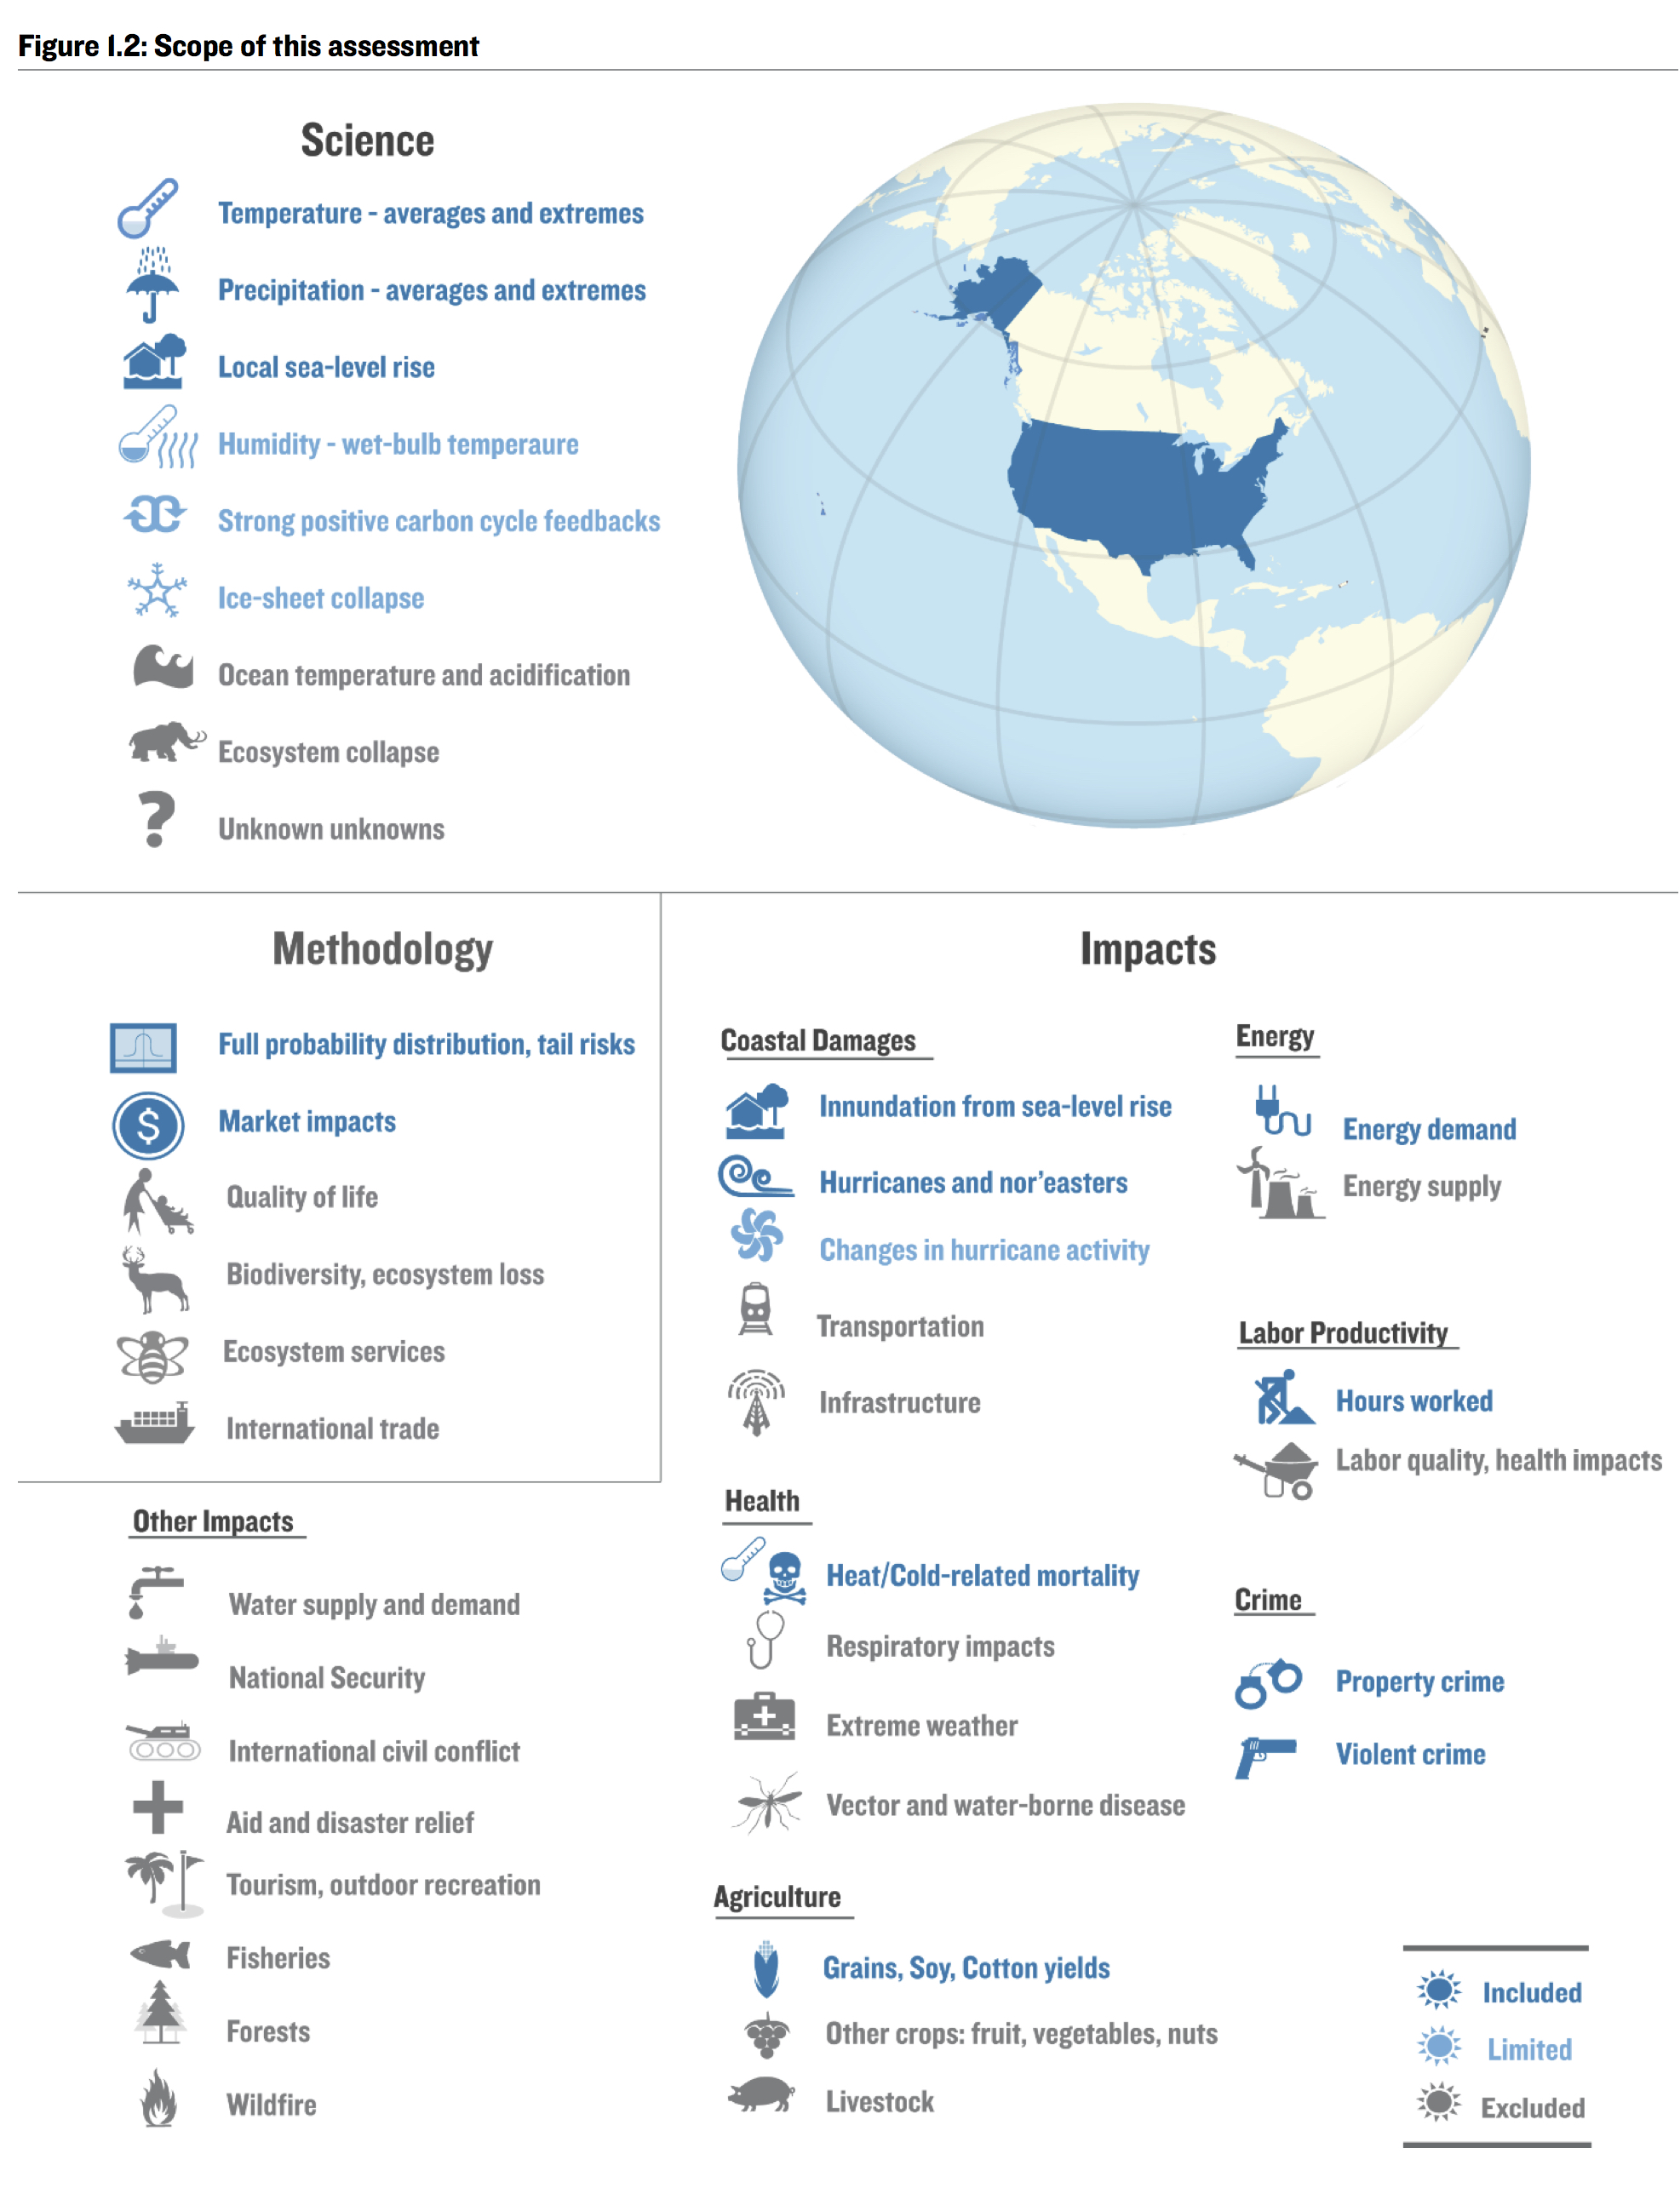
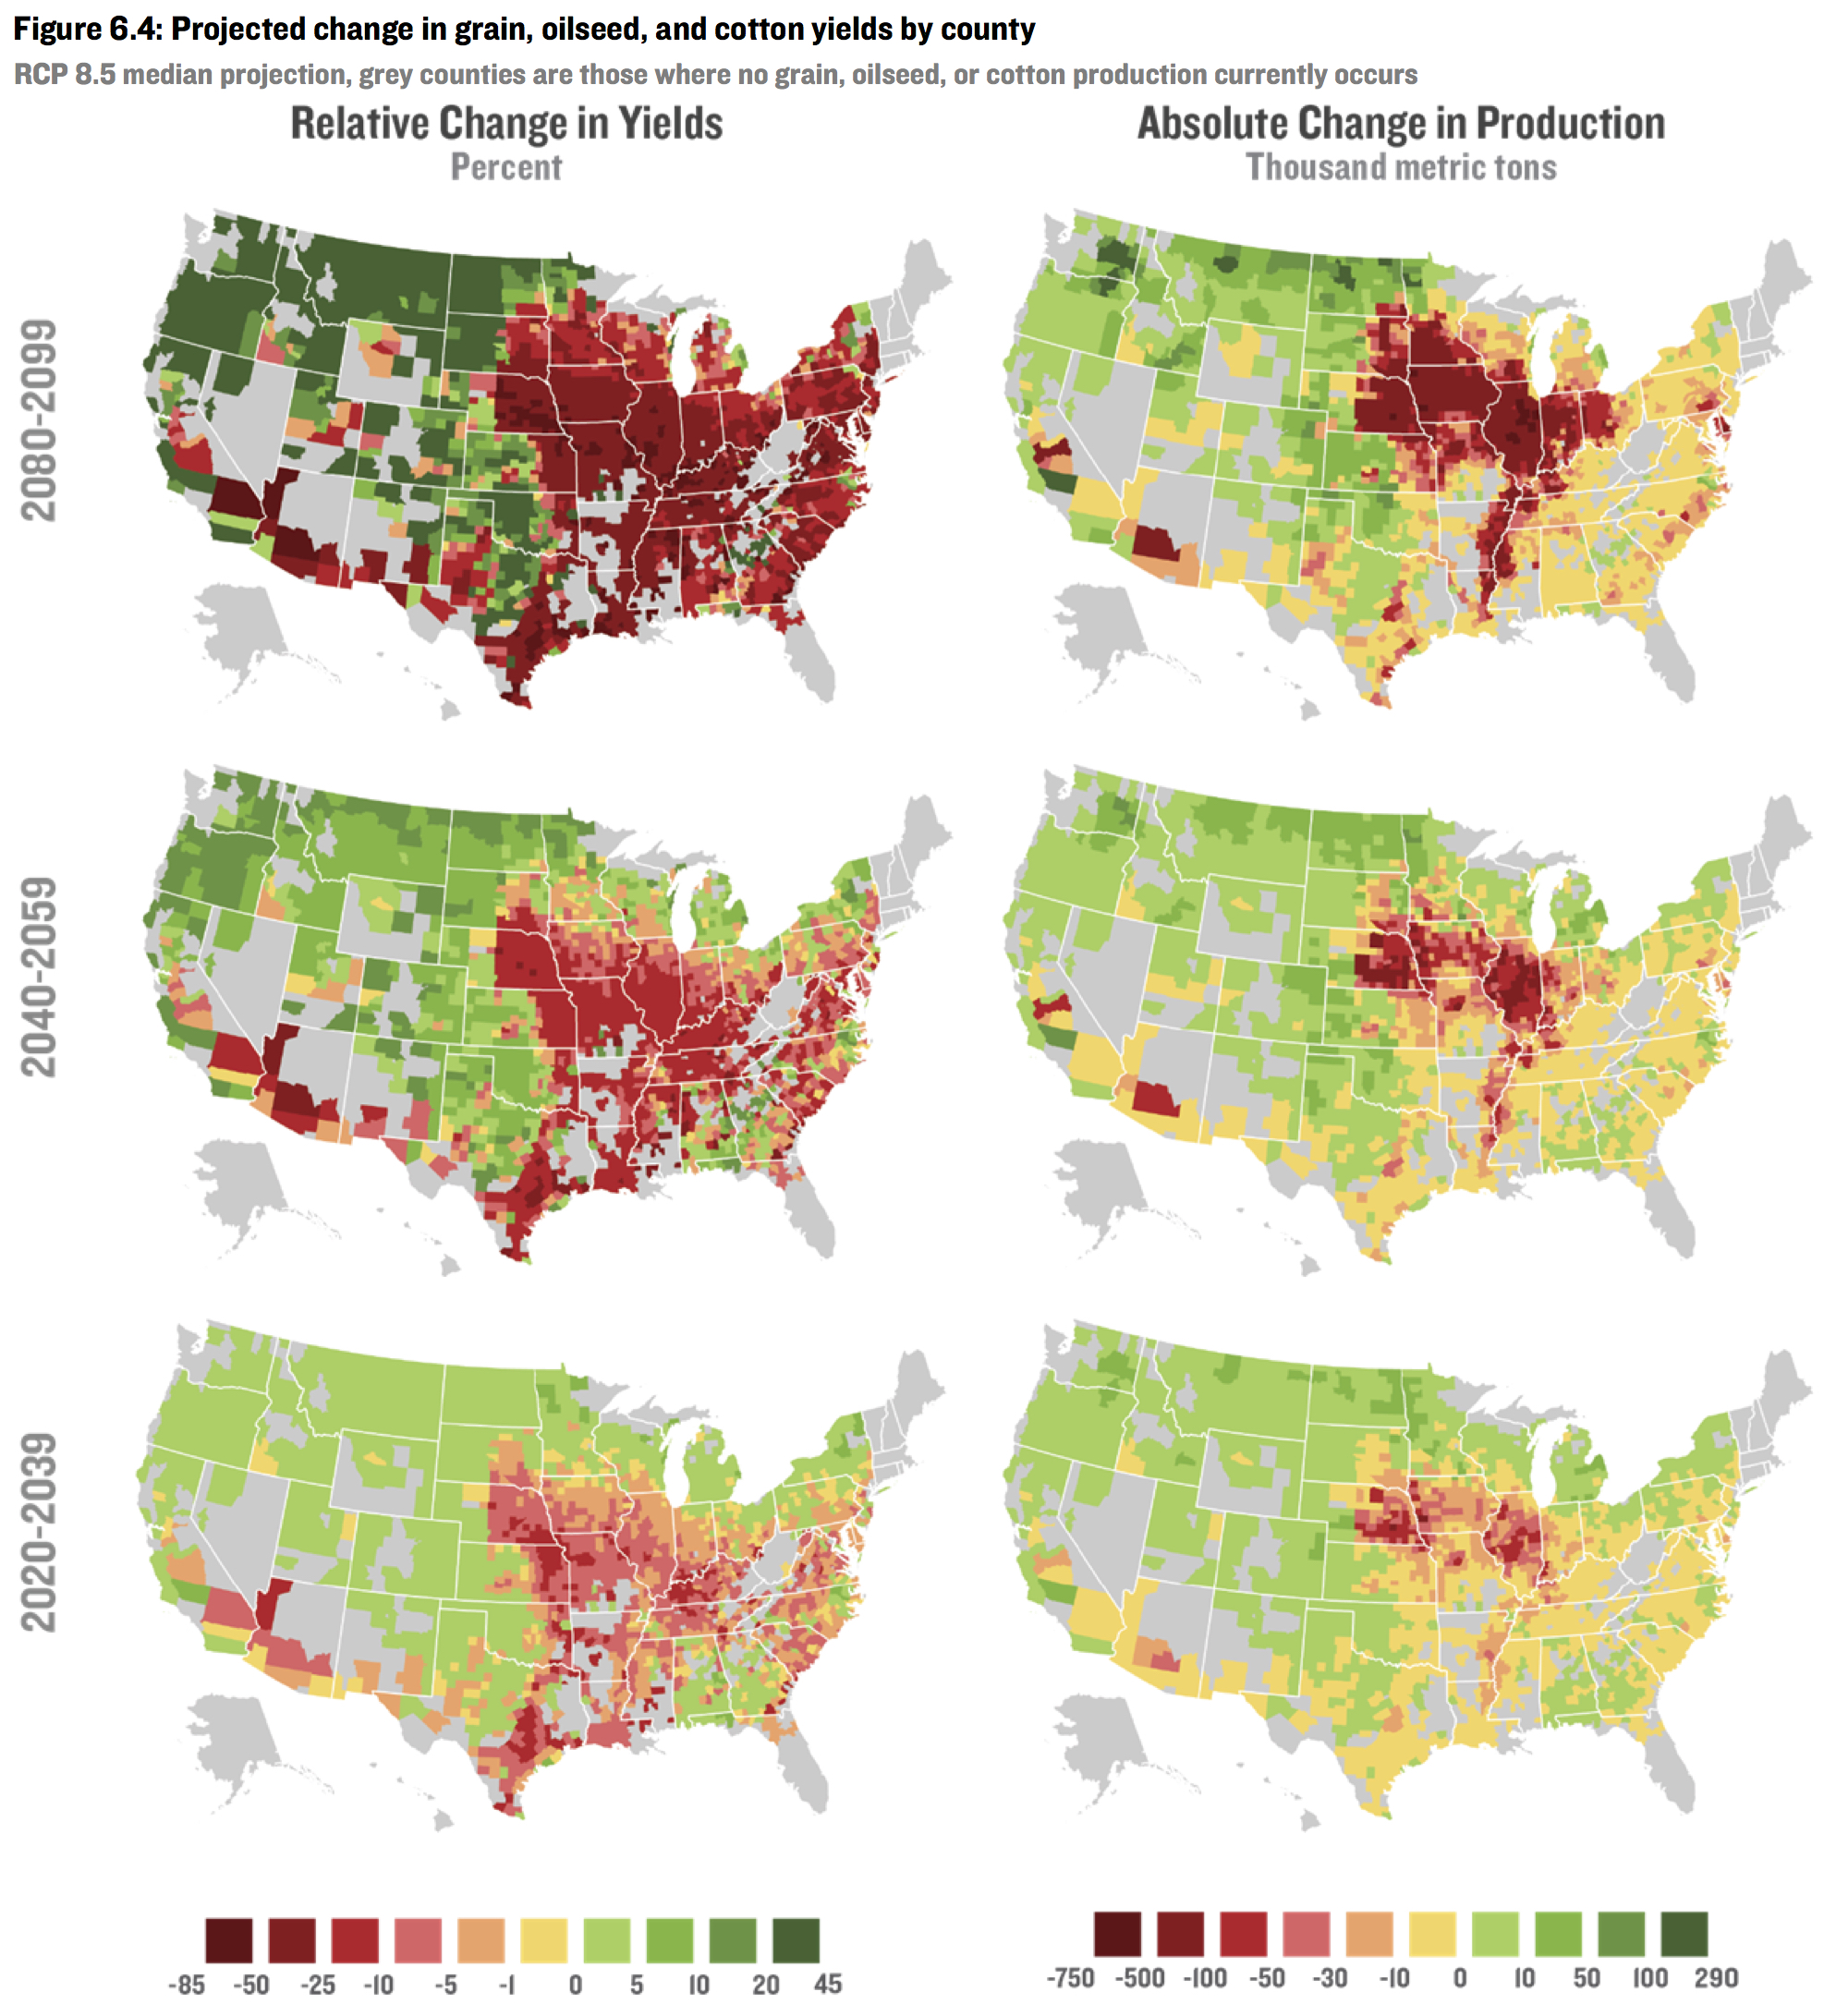
They estimate the effect of changes in temperature and humidity on mortality, a variety of crops, energy use, labor force, and crime, at the county level through 2099.
"evidence-based approach."
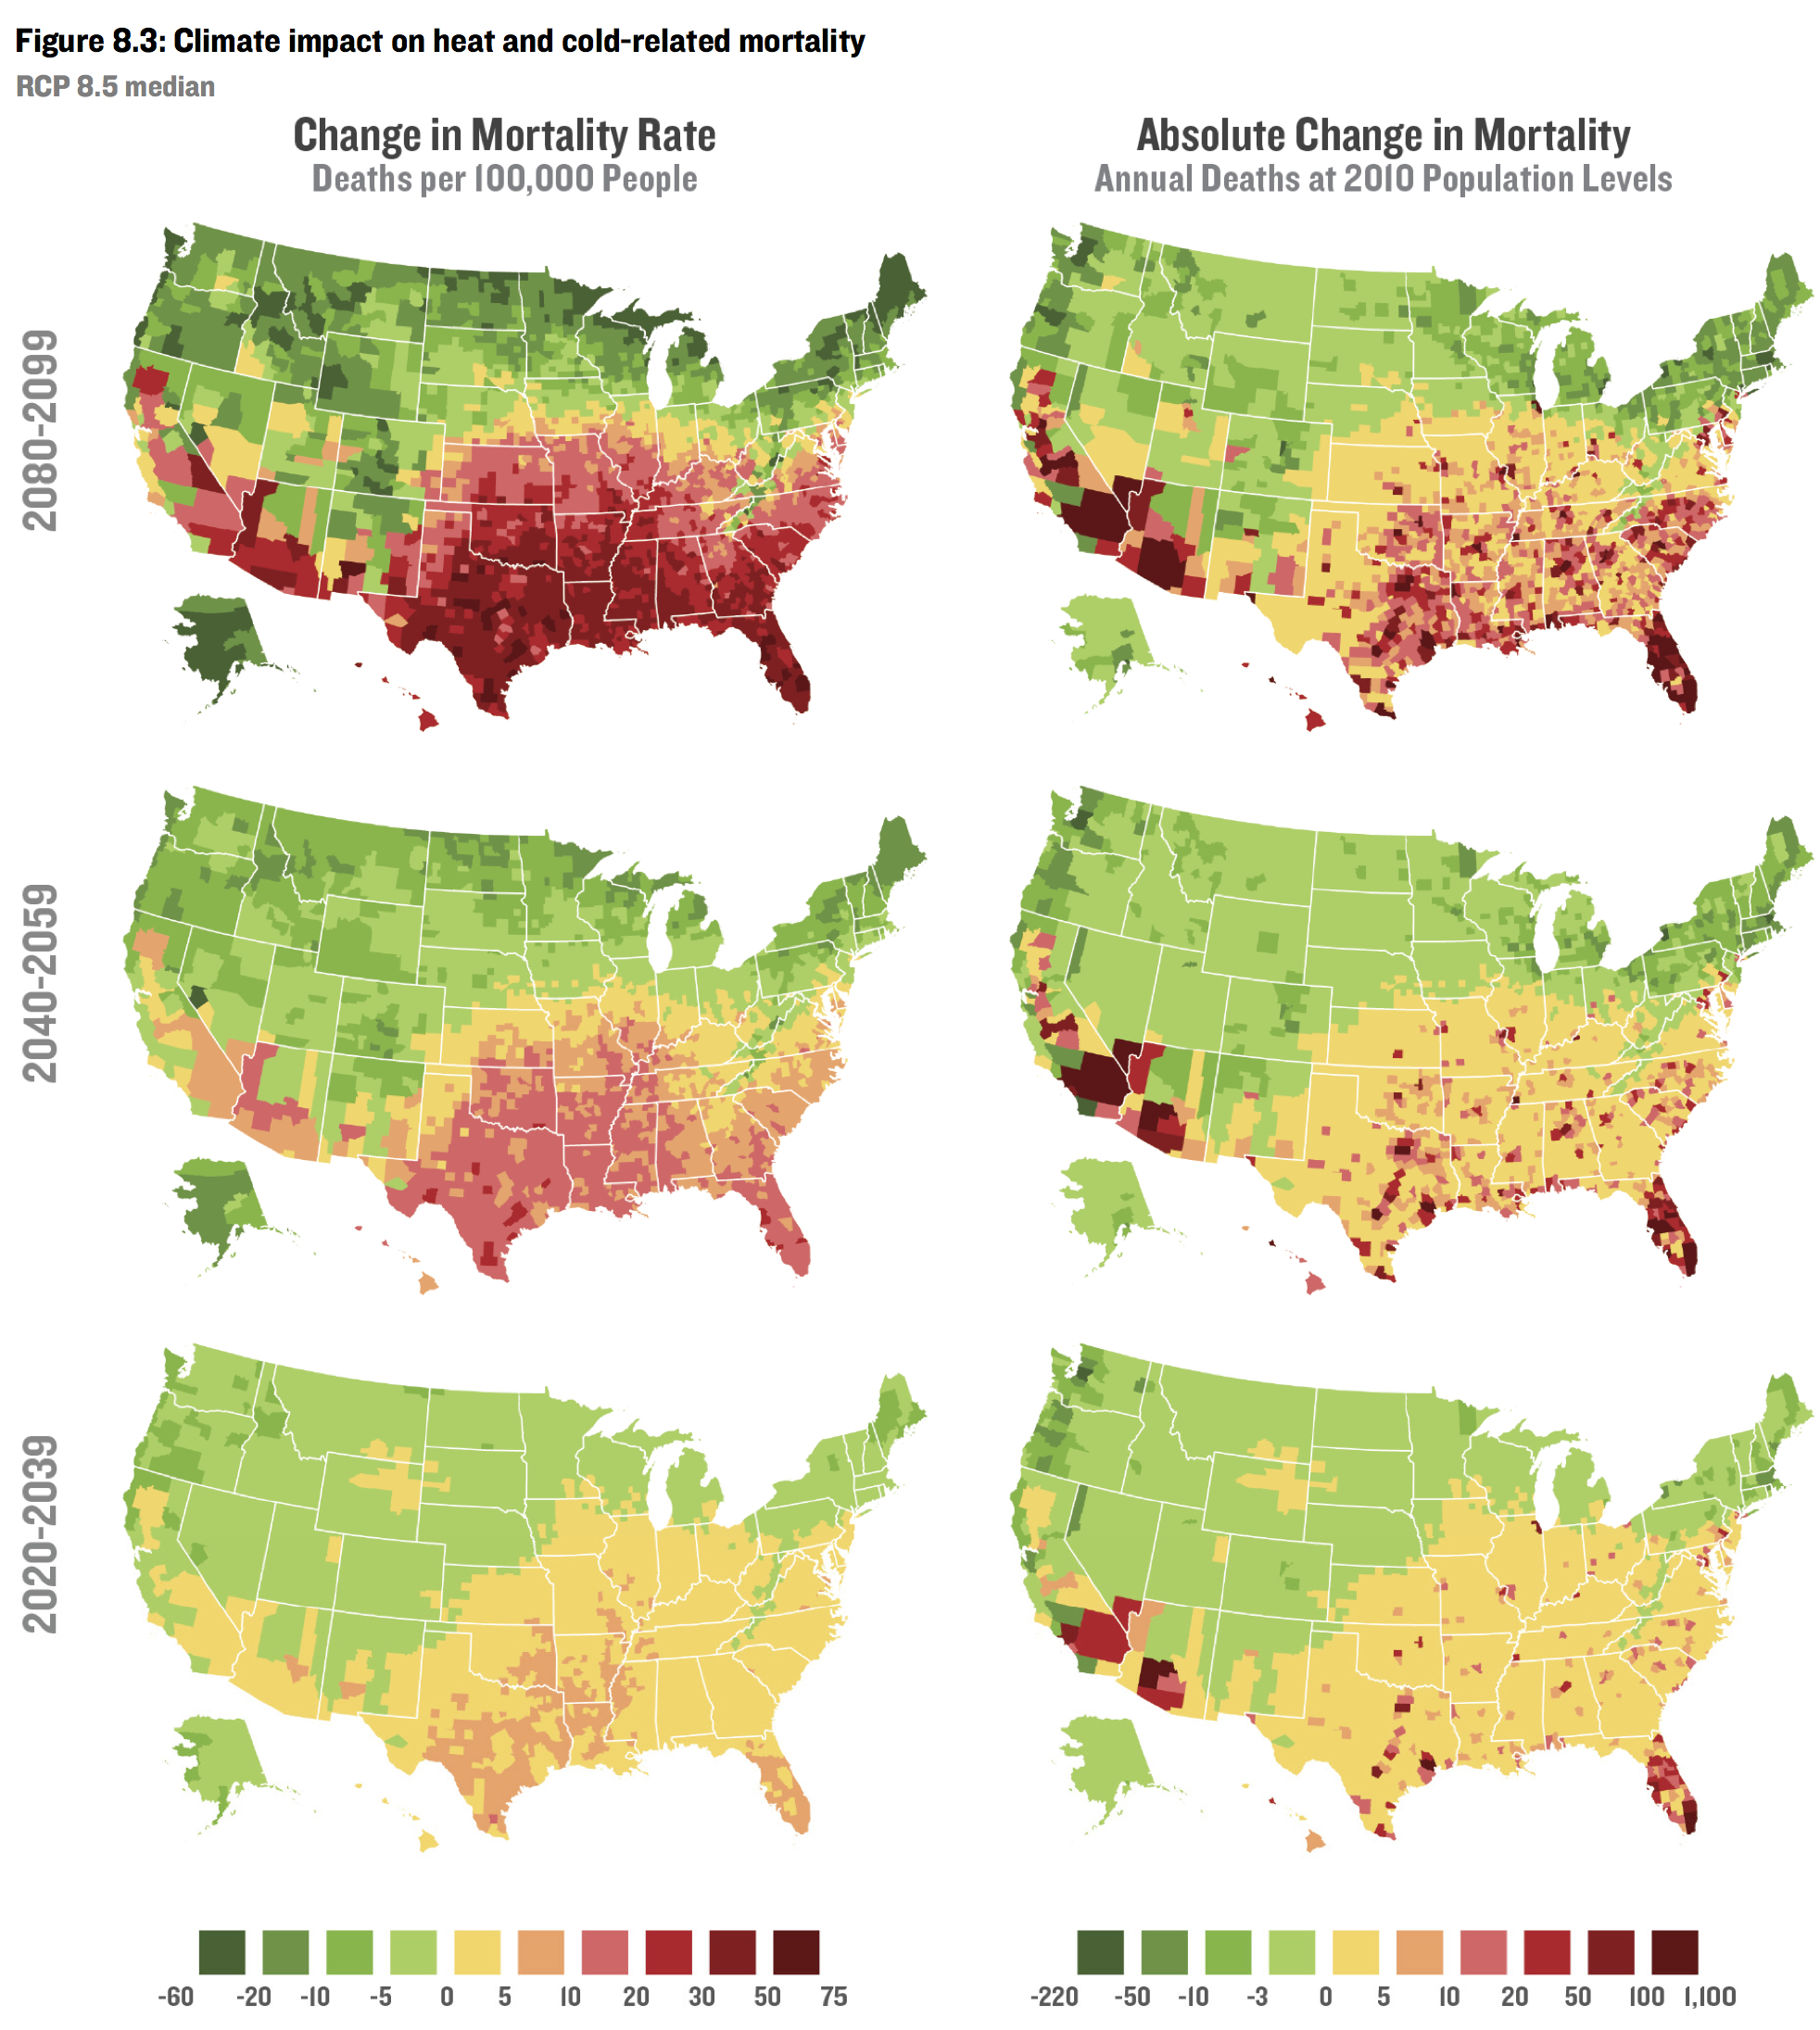
Sanity check
Even the notion that if you knew the temperature and humidity in every cubic centimeter of the atmosphere for the next hundred years, you could accurately predict the effect on violent crime is absurd.
Adding the uncertainty in temperature and humidity obviously doesn't make the problem easier.
Ditto for labor, crop yields, mortality, etc.
And that's even if ceteris were paribus—which they will not be.
And that's even for next year, much less for 80 years from now.
And that's even for predicting a global average, not county-level predictions.
References
- Cornell, C.A., 1968. Engineering seismic risk analysis, Bull. Seism. Soc. Am, 58, 1583--1606.
- Evans, S.N., B. Hansen, and P.B. Stark, 2005. Minimax Expected Measure Confidence Sets for Restricted Location Parameters, Bernoulli, 11, 571–590. Also Tech. Rept. 617, Dept. Statistics Univ. Calif Berkeley (May 2002, revised May 2003). Preprint: https://www.stat.berkeley.edu/~stark/Preprints/617.pdf
- Evans, S.N. and P.B. Stark, 2002. Inverse Problems as Statistics, Inverse Problems, 18, R55–R97. Reprint: http://iopscience.iop.org/0266-5611/18/4/201/pdf/0266-5611_18_4_201.pdf
- Feynman, R., 1974. CalTech Commencement Address,
http://calteches.library.caltech.edu/51/2/CargoCult.htm - Freedman, D.A., 1995. Some issues in the foundations of statistics, Foundations of Science, 1, 19--39. https://doi.org/10.1007/BF00208723
- Freedman, D.A., 1999. From association to causation: some remarks on the history of statistics, Statistical Science, 14(3), 243--258.
- Freedman, D.A., 2008. On types of scientific inquiry: the role of qualitative reasoning, The Oxford Handbook of Political Methodology, Box-Steffensmeier, J.M., H.E. Brady, and D. Collier (eds), Oxford University Press, Oxford. DOI: 10.1093/oxfordhb/9780199286546.003.0012. Preprint
- Freedman, D.A., 2009. Statistical Models: Theory and Practice, 2nd edition, Cambridge University Press.
- Hengartner, N.W. and P.B. Stark, 1995. Finite-sample confidence envelopes for shape-restricted densities, The Annals of Statistics, 23, 525–550.
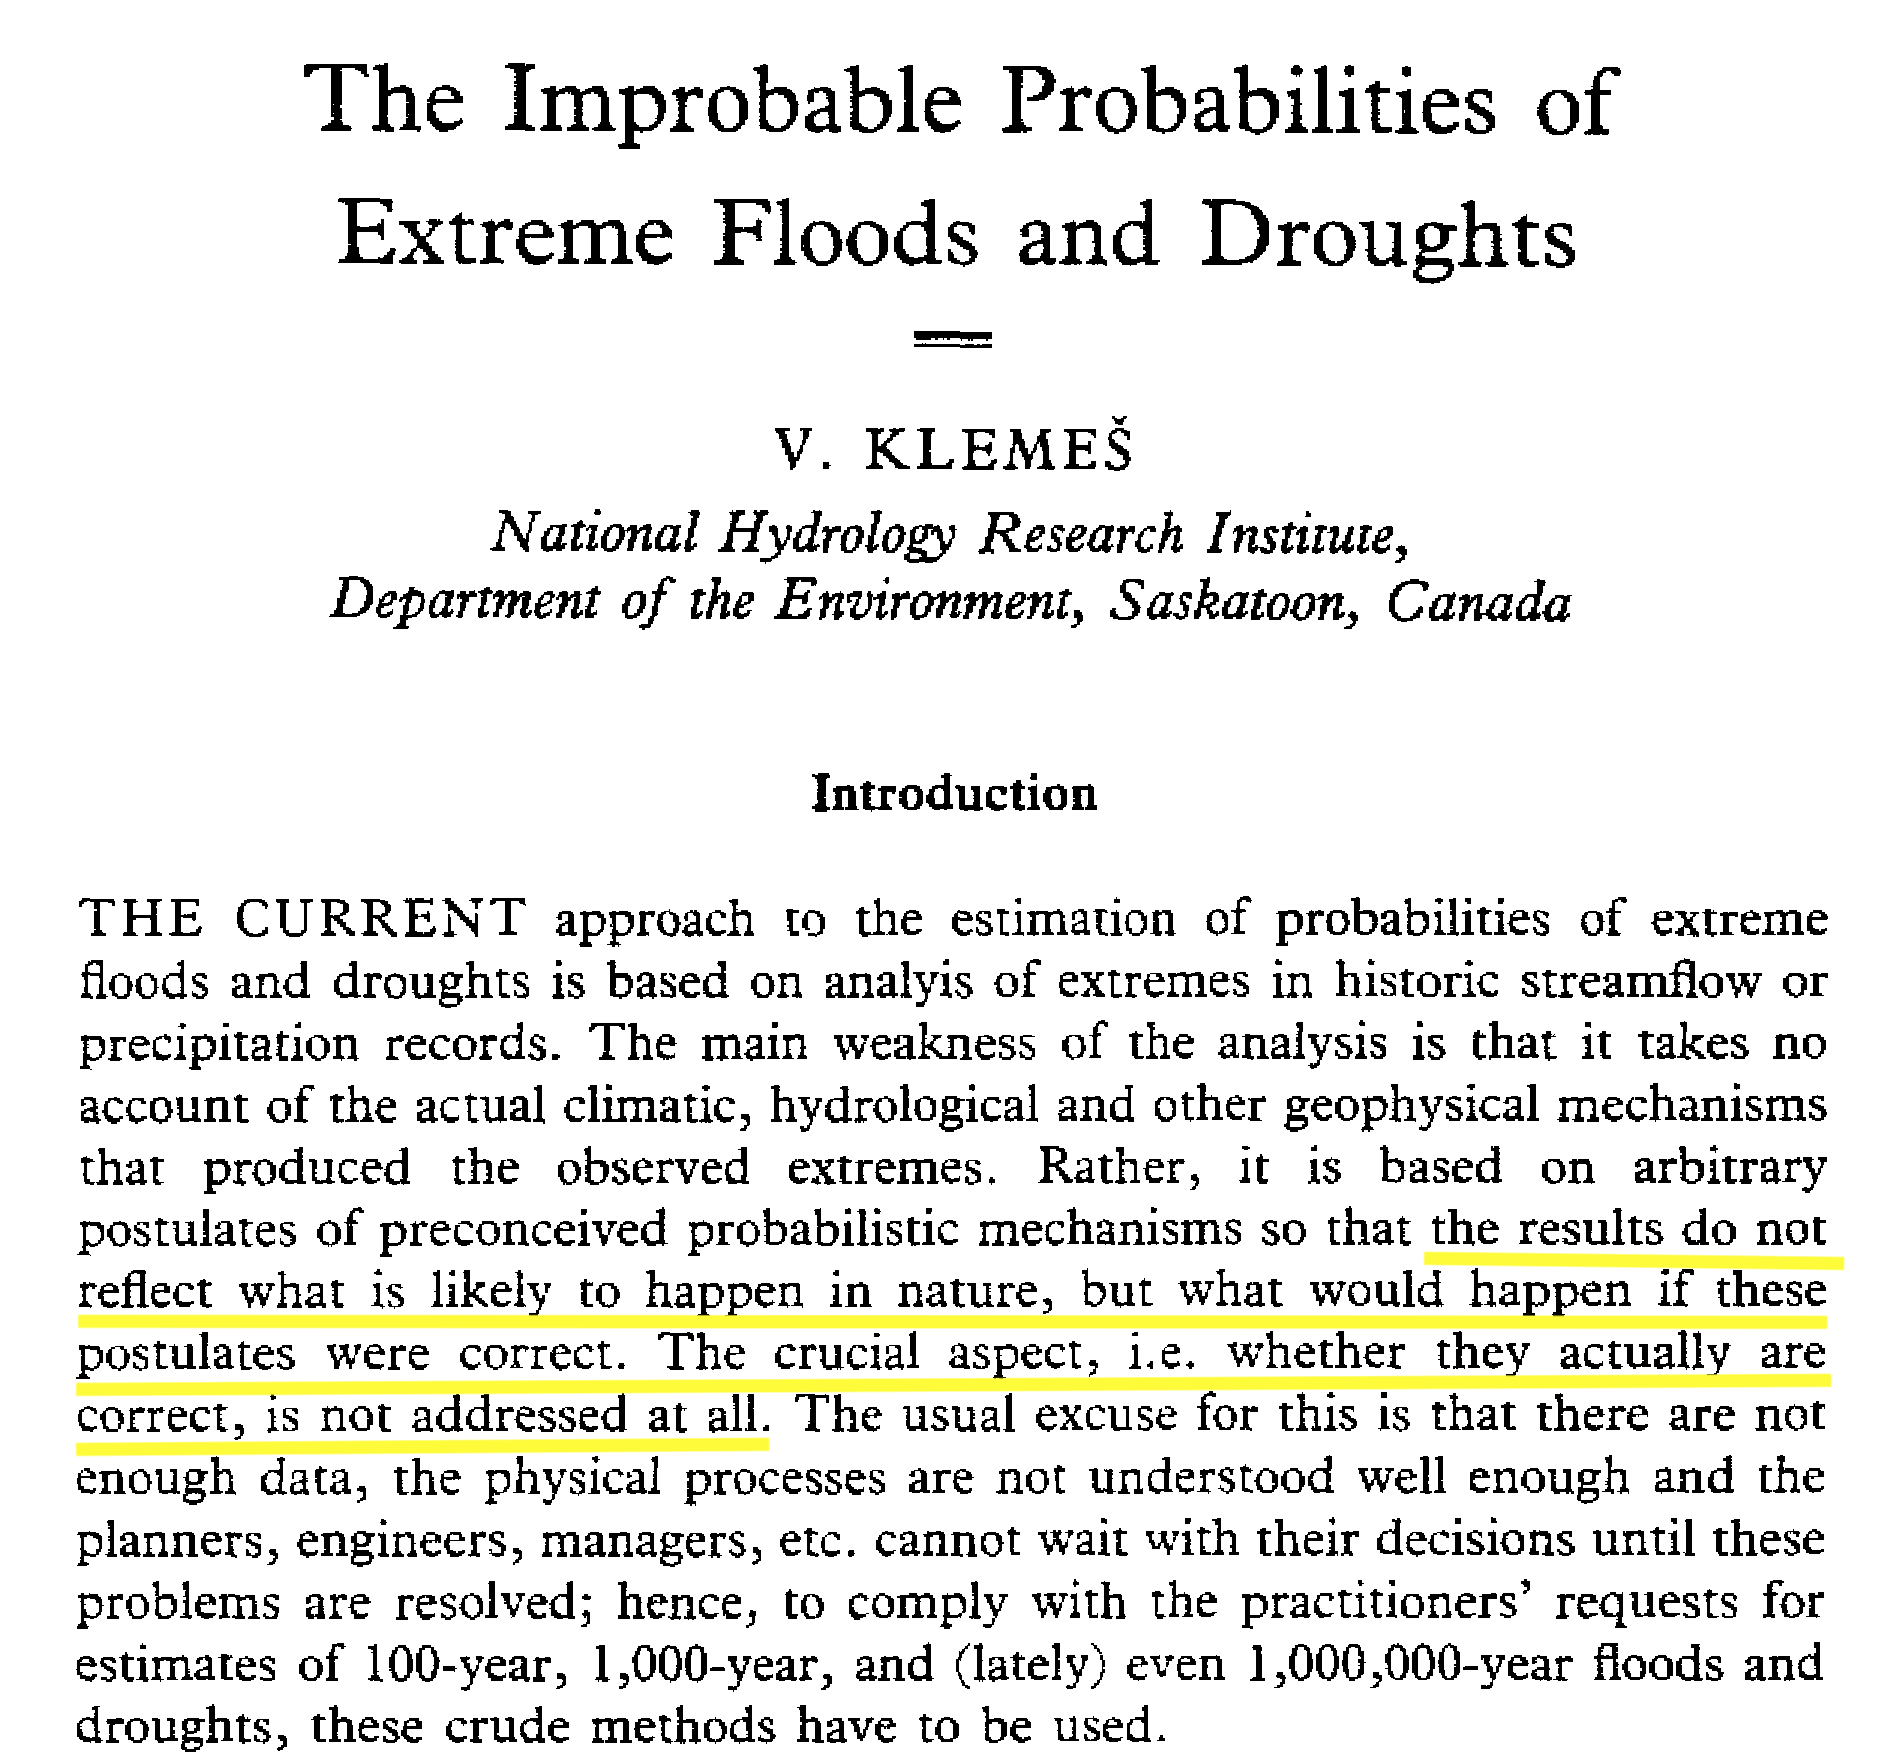
- Klemes, V., 1989. The Improbable Probabilities of Extreme Floods and Droughts, in O. Starosolsky and O.M. Meldev (eds), Hydrology and Disasters, James and James, London, 43--51.
https://www.itia.ntua.gr/en/getfile/1107/1/documents/1997_ImprobProbabilities_OCR.pdf - Kuusela, M., and P.B. Stark, 2017. Shape-constrained uncertainty quantification in unfolding steeply falling elementary particle spectra, Annals of Applied Statistics, 11, 1671–1710. Preprint: http://arxiv.org/abs/1512.00905
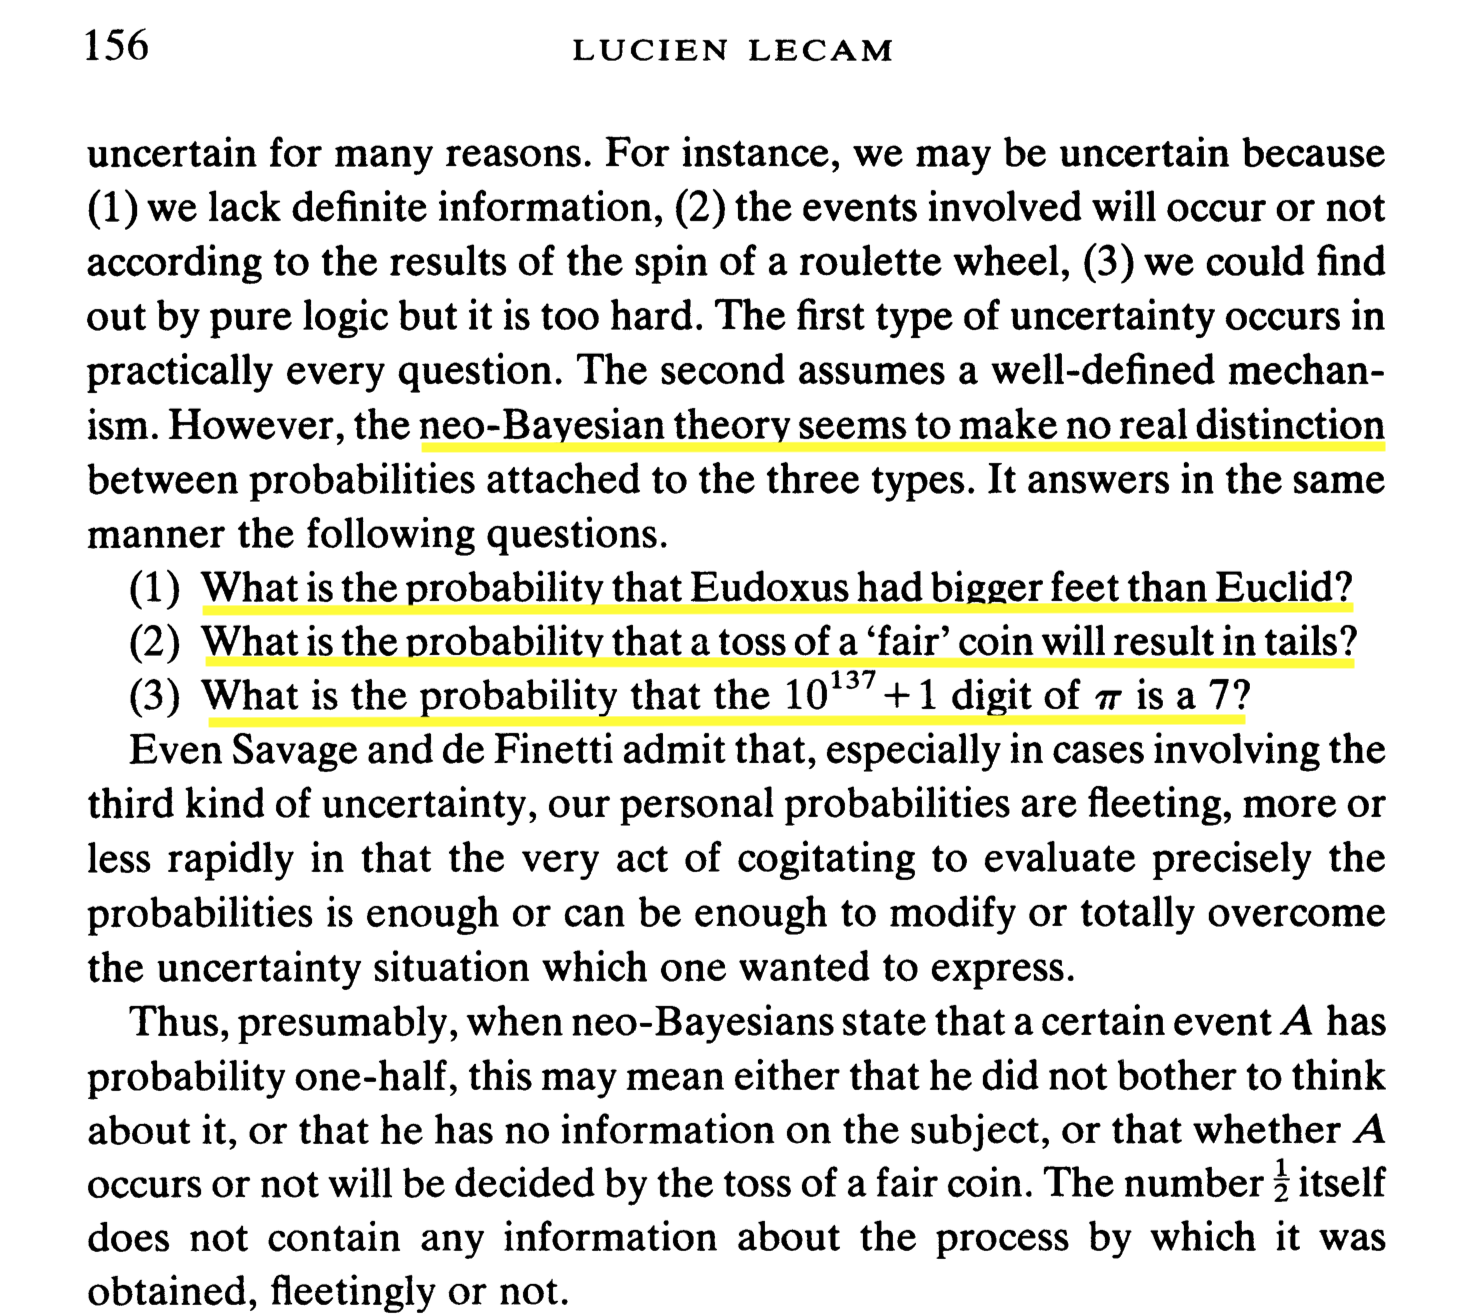
- LeCam, L., 1977. Note on metastatistics or 'An essay toward stating a problem in the doctrine of chances,' Synthese, 36, 133-160.
- Schafer, C.M., and P.B. Stark, 2009. Constructing Confidence Sets of Optimal Expected Size. Journal of the American Statistical Association, 104, 1080–1089. Reprint: https://www.stat.berkeley.edu/~stark/Preprints/schaferStark09.pdf
- Stark, P.B., 2008. Generalizing resolution, Inverse Problems, 24, 034014. Reprint: https://www.stat.berkeley.edu/~stark/Preprints/resolution07.pdf
- Stark, P.B., and D.A. Freedman, 2003. What is the Chance of an Earthquake?, in Earthquake Science and Seismic Risk Reduction, F. Mulargia and R.J. Geller, eds., NATO Science Series IV: Earth and Environmental Sciences, v. 32, Kluwer, Dordrecht, The Netherlands, 201-213. https://www.stat.berkeley.edu/~stark/Preprints/611.pdf
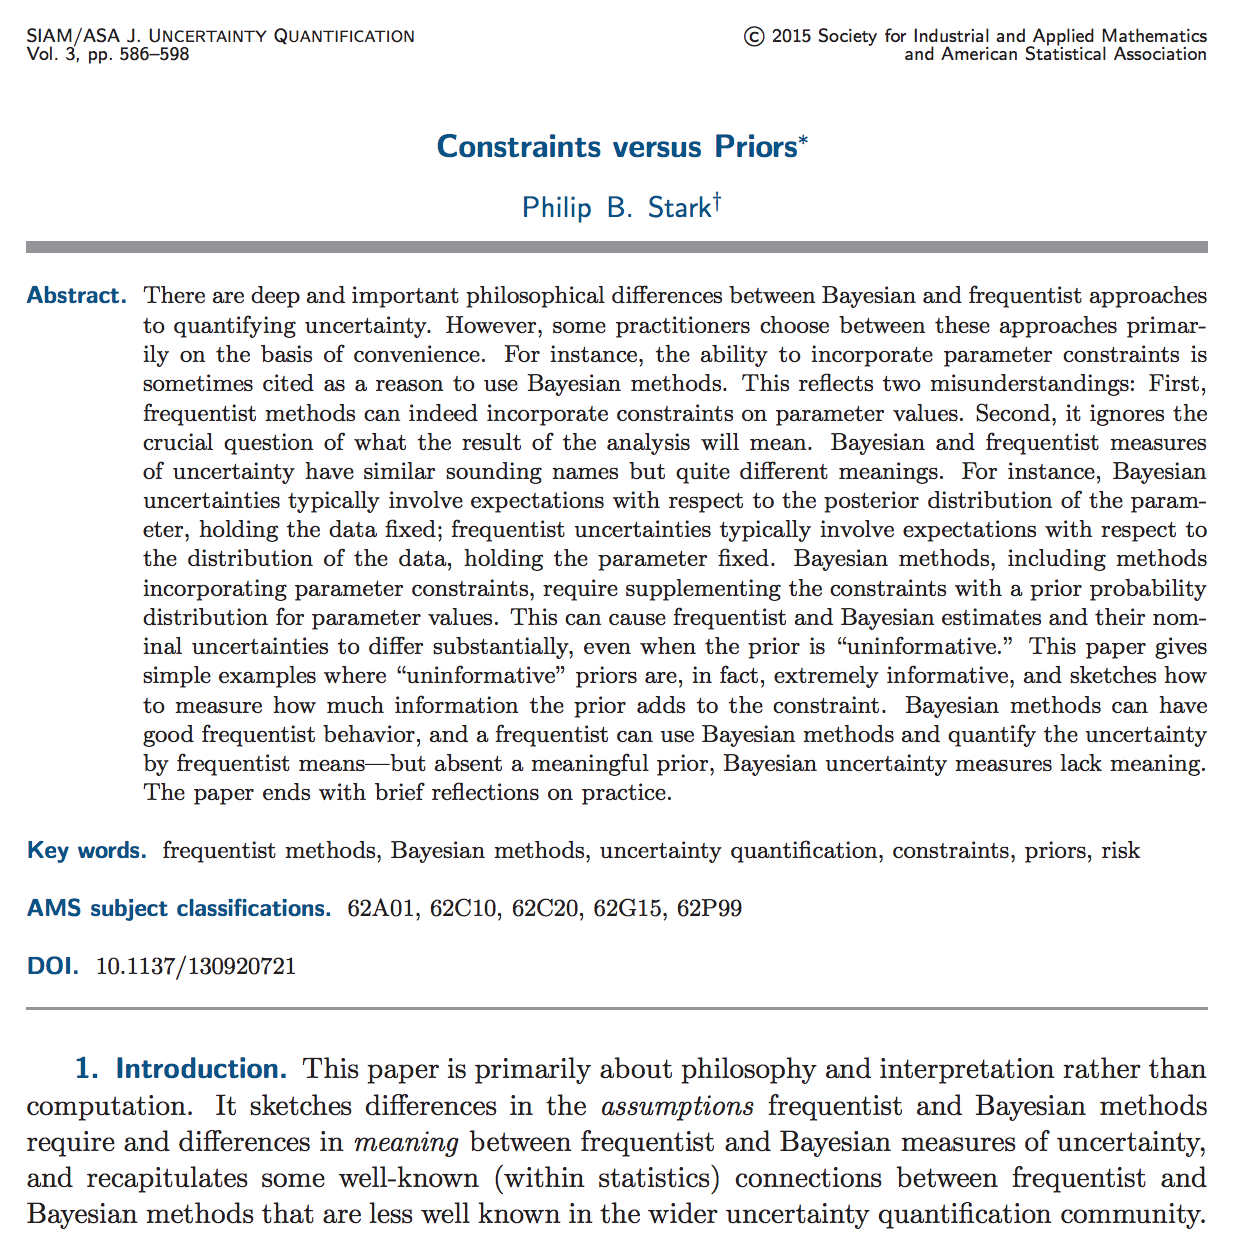
- Stark, P.B., 2015. Constraints versus priors. SIAM/ASA Journal on Uncertainty Quantification, 3(1), 586--598. doi:10.1137/130920721,
Reprint: http://epubs.siam.org/doi/10.1137/130920721,
Preprint: https://www.stat.berkeley.edu/~stark/Preprints/constraintsPriors15.pdf. - Stark, P.B., 2016a. [Pay no attention to the model behind the curtain (https://www.stat.berkeley.edu/~stark/Preprints/eucCurtain15.pdf)
- Stark, P.B., 2017. Mathematical Foundations, Inequalities, Introduction to permutation tests, Rabbits and Cargo-Cult Statistics, Generating pseudo-random samples and permutations
- Stark, P.B., and A. Saltelli, 2018. Cargo-cult Statistics and Scientific Crisis, Significance, 15(4), 40--43. Preprint: https://www.significancemagazine.com/593
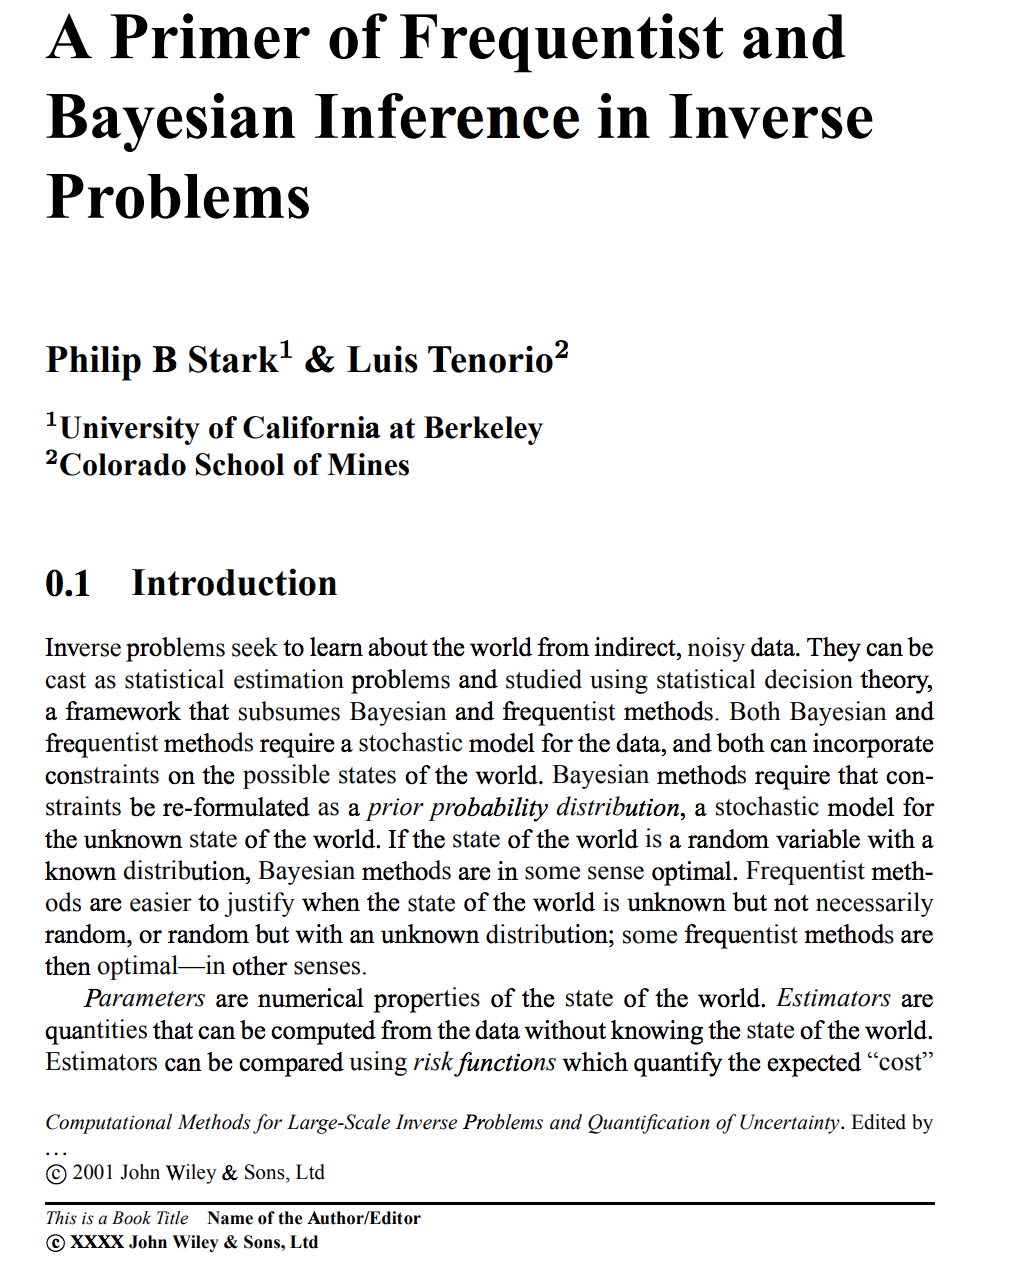
- Stark, P.B. and L. Tenorio, 2010. A Primer of Frequentist and Bayesian Inference in Inverse Problems. In Large Scale Inverse Problems and Quantification of Uncertainty, Biegler, L., G. Biros, O. Ghattas, M. Heinkenschloss, D. Keyes, B. Mallick, L. Tenorio, B. van Bloemen Waanders and K. Willcox, eds. John Wiley and Sons, NY. Preprint: https://www.stat.berkeley.edu/~stark/Preprints/freqBayes09.pdf