Figure from the GONG website.
Many figures stolen (with gratitude but not remorse) from the websites of
For more background information, see those sites, and the award-winning Stanford Solar Center, and the 31 May 1996 special issue of Science, devoted to helioseismology and the GONG experiment.
Some of the work described is joint with (variously) I. Fodor, D.O. Gough, Y. Gu, R. Komm, C.R. Genovese, T. Sekii, M.J. Thompson.
Helioseismology is the study of the interior of the Sun from observations of the vibrations of its surface.
The Sun is nearly opaque to electromagnetic energy: it takes about 170,000 years for radiation to get to the surface from the core.
On the other hand, the Sun is essentially transparent to neutrinos, and to acoustic waves. Using acoustic energy, we can "see into the Sun" in a way that is quite similar to using ultrasound to image the interior of the human body.
Oscillations of stars have been recognized since the late 1700s. The complicated pattern of the Sun's oscillation was first observed in 1960 by Robert Leighton, Robert Noyes, and George Simon.
The explanation of the pattern in terms of trapped acoustic waves came in 1970-71 by Roger Ulrich, John Leibacher, and Robert Stein. This explanation predicted certain detailed features of the spectrum of solar oscillations that were confirmed by observations made in 1975 by Franz Deubner.
The Sun is constantly vibrating in a superposition of acoustic normal modes (like the patterns with which a guitar string vibrates, but for a spherical body rather than a string). The characteristic period of oscillation is about 5 minutes. It takes on the order of a few hours for the energy to travel through the Sun. The velocity amplitude of solar p-modes is about 1 cm/s; the relative brightness variation is about 10-7.
Mode lifetimes range from hours to months. Modes are typically excited many times per lifetime.
The modes are thought to be excited by turbulence in the convection zone.
About 107 distinct modes are thought to be excited; of those, over 250,000 have been identified. It is thought that within a few years, well over a million modes will have been identified.
Helioseismology is rather like trying to understand how a piano is built from the sounds that it makes when you drop it down a flight of stairs.
Here are two movies of the motion of the surface of the Sun, after filtering out solar rotation: GONG movie (from the GONG website) SOI Movie (from the Stanford SOHO-SOI website).
Here are some filtered, speeded-up sounds of the Sun, processed by A. Kosovichev of the Stanford SOHO-SOI group. 40-day time series of normal mode coefficients were combined and speeded up by a factor of 42,000. One mode (l=1, n=20), three modes, all low-degree modes (l=0, 1, 2, 3).
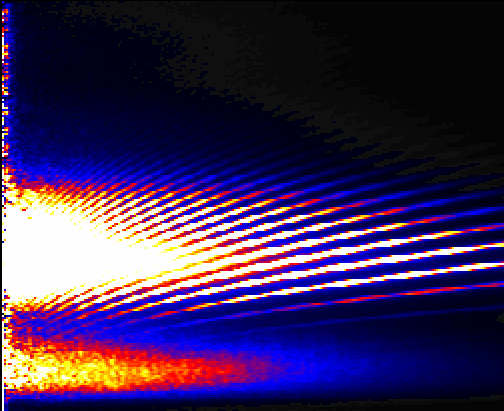
One can look at the power in the motion as a function of angular scale and temporal frequency, to obtain a multi-dimensional power spectrum:

Figure from the GONG website.
The observations of the Sun's oscillations are much better than our observations of Earth's oscillations (low-frequency geoseismology), partly because the oscillations go on constantly (for the Earth, it takes a sizeable earthquake to excite observable oscillations), and partly because we can observe almost half the Sun at any time (on Earth, seismic stations are scattered pretty sparsely). (The "almost" comes from the fact that the solar limb is so noisy that it is usually masked out of the data processing.)
To have a wave or a normal mode, the material must "push back" when it is pushed, like a spring. The source of this "restoring force" gives rise to different kinds of oscillations and to modes that sample different parts of the Sun. The observed modes of the Sun are surface gravity modes (f-modes: the f stands for "fundamental") and p-modes, for which the restoring force is pressure.
The particle motion associated with f-modes and p-modes is essentially confined to a region outside the solar core (the ray paths that the energy travels have turning depths above the core), so those modes contain little information about the deepest parts of the Sun.
In the core, negative buoyancy acts as a restoring force, so the core supports "g-modes," for which gravity is the restoring force.
g-modes sample the core well, but their associated particle motion is essentially confined to the core. Their amplitudes at the observable surface of the Sun are quite small, and as yet, there is no convincing report that they have been detected at all.
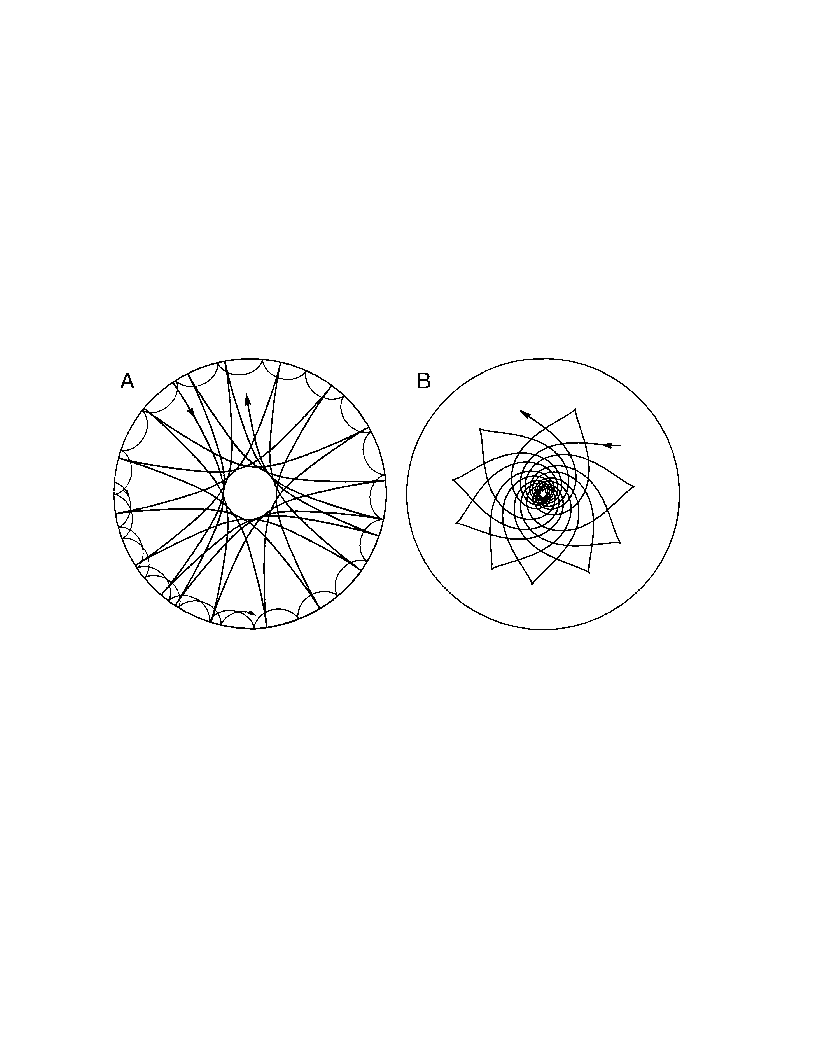
Figure from GONG website. See Gough, Leibacher, Scherrer, and Toomre, Science,
272, 1281-1283. The left figure shows ray paths
associated with two p modes (shallow is l=100, n=8;
deep is l=2, n=8); the right shows the ray path
associated with a g mode (l=5, n=10).
The patterns that individual modes make at the surface of the Sun are quite similar to spherical harmonics Ylm, which are the analogues of sines and cosines on the sphere. (They are eigenfunctions of Laplaces's equation; they diagonalize any operator that commutes with rigid-body rotation.)
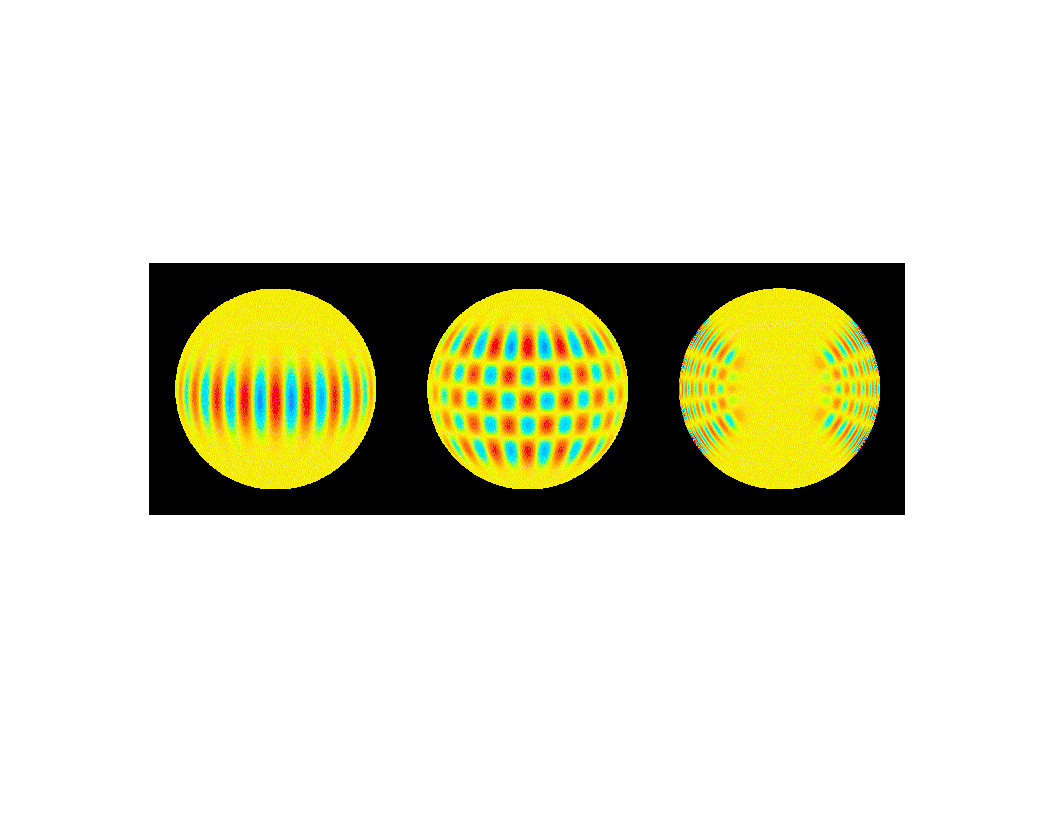
Figure from GONG website. See Gough, Leibacher, Scherrer, and Toomre, Science,
272, 1281-1283. Left: line-of-sight component of
velocity for l=20, m=20 mode. Middle:
line-of-sight component of velocity for l=20, m=16
mode. Right: meridional cut through eigenfunction for density
perturbation (scaled for clarity).
Modes are indexed by 3 "quantum numbers:" the radial order n, the angular degree l, and the angular order m.
Modes with small n and l penetrate more deeply into the Sun.
For each value of l, there are 2l+1 possible values of m: -l, -l+1, ... , 0, 1, ..., l-1, l.
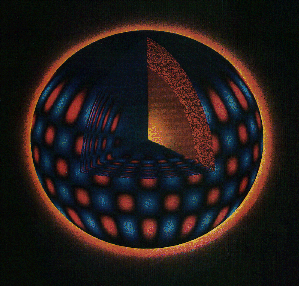
Figure from the GONG website
If the Sun were spherically symmetric and did not rotate, the frequencies of the 2l+1 modes with the same values of l and n would be the same.
Rotation and asphericity break the symmetry of the system and the degeneracy of the eigenfrequencies.
Differential rotation splits the "singlets" symmetrically, while asphericity splits them anti-symmetrically.
To first order in the (small) rotation rate, the relationship between the portion of the angular velocity distribution that is symmetric w.r.t. the solar equator, and the odd (in m) component of the splitting, is linear, if one pretends that the eigenfunctions of the oscillations are known.
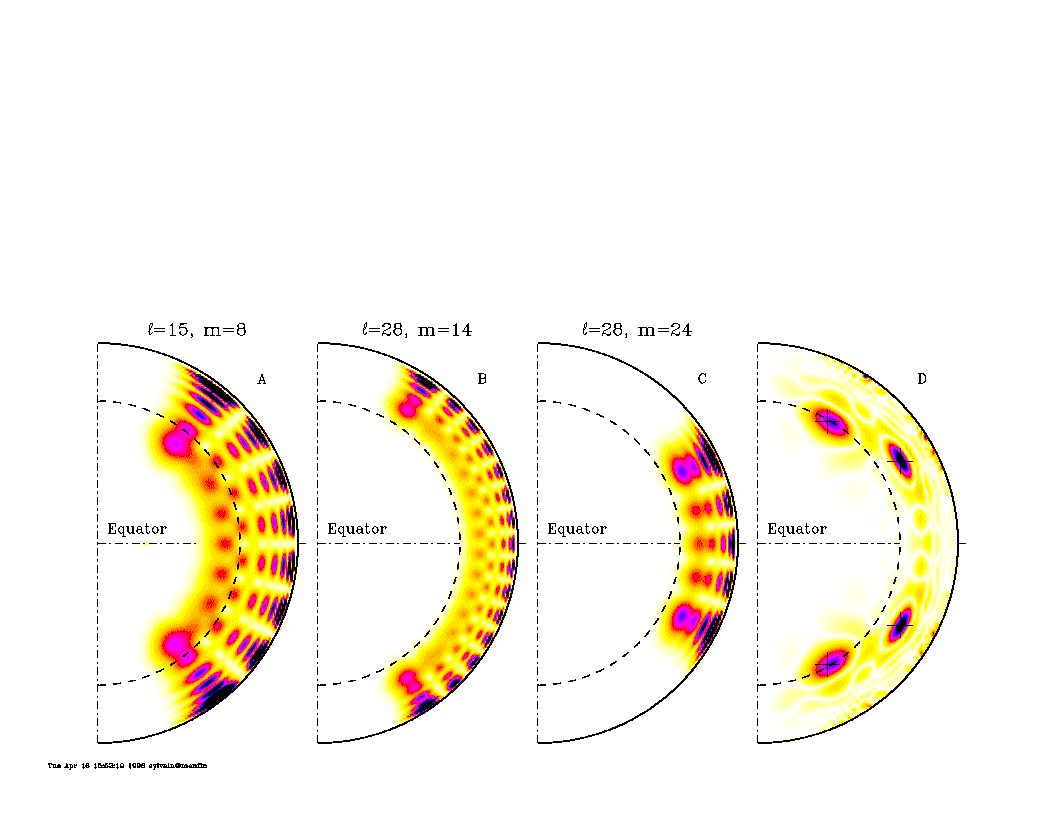
Figure from the GONG website. See Thompson, Toomre, Anderson, and 26 others,
1996. Science, 272, 1300-1305. The left three
figures show the sensitivity of some frequency splittings to
rotation of the Sun at different latitudes and depths. The
rightmost figure shows a combination of splitting sensitivities
designed to "target" the rotation at certain places
within the Sun.
Learn about the composition, state, and dynamics of the interior of the closest star, including sunspots, the heliodynamo, and the solar cycle
Test and improve theories of stellar evolution
Use the Sun as a physics laboratory to study conditions unattainable on Earth (e.g., the neutrino problem, the equation of state, opacity)
Predict space weather by imaging the far side of the Sun
The agreement between the predicted spectra for ab initio models and the observed spectra was truly remarkable, but as observations improved (and error bars decreased), it became clear that the "standard solar model" was wrong in important ways.
"Plasma rivers" in the Sun. The SOHO-SOI/MDI team announced last year the discovery of "plasma rivers" in the Sun, (press release) where the flow of solar plasma is about 10% faster than the surrounding material. This was one of the top 10 NASA stories for 1997.
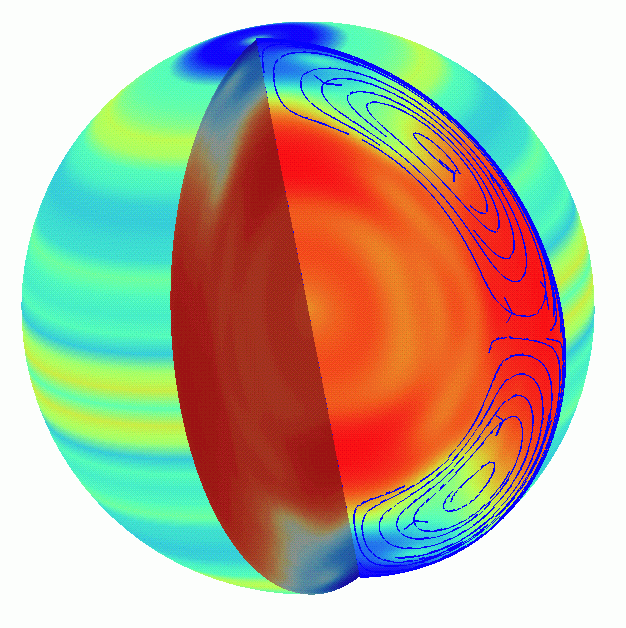
Figure from Stanford Univ., the SOHO-SOI/MDI website.
Here is a movie from the Stanford SOHO-SOI group showing the rotation.
There are a number of experiments in different countries, ranging from networks that view the Sun as a star (spatially unresolved) to very high resolution single stations. I'll just describe the two I am affiliated with. These are the experiments with high spatial resolution and the highest duty cycles. Duty cycle is quite important, because gaps in the observation series result in spurious artifacts in the estimates of the spectrum of solar oscillations.
The Global Oscillations Network Group (GONG) is a 6-station ground-based network funded by the NSF.
The Solar and Heliospheric Observer Solar Oscillations Investigation (SOHO-SOI) is a satellite-based experiment funded by NASA and ESA.
Both try to get essentially continuous observations, GONG, by having a globe-spanning network on which the Sun never sets, and SOHO-SOI by observing from space (a halo orbit around the L1 Lagrange point).
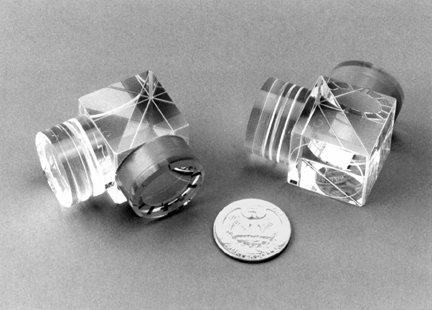
Figure from the GONG website
These cubes are the heart of the Michelson Doppler Interferometers used both by GONG and SOHO-SOI/MDI to determine the pattern of motion of the solar surface. Fourier tachymeters for measuring solar oscillations were first developed by Tim Brown (HAO/NCAR) in the 1980's. The basic idea is to use a sequence of filters to isolate an absorption line originating in the mid-photosphere (Ni I, 676.8nm), then use tunable interferometers to measure the intensity at several frequencies in a small band; these can in turn be converted to estimates of the Doppler shift in the absorption line, and hence to a velocity. This is done in each pixel of the image (in a CCD camera essentially identical to ones used in video cameras), resulting in a spatially resolved image of the velocity of the Sun's surface. Both GONG and SOHO-SOI/MDI produce one such image per minute. The SOHO-SOI/MDI camera has 1024 by 1024 pixels; the GONG cameras have 242 by 256 pixels. The overall data collection rate for GONG is about 38Gb/month. The basic analysis unit for studying oscillations is a time series of 36 or 72 days of such time series (51,840 or 103,680 images).
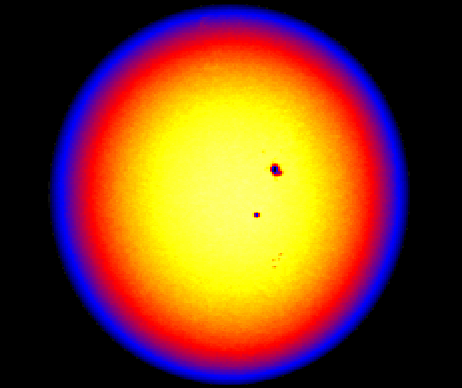
Figure from the GONG website
This is a raw intensity image of the Sun through the GONG instrument.
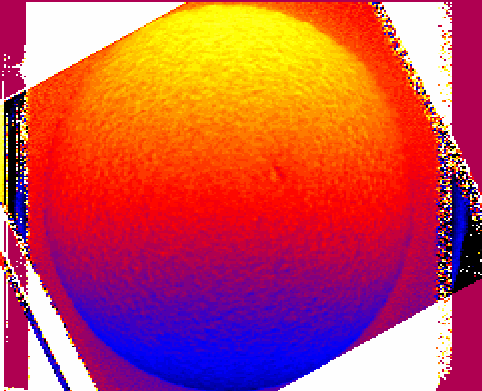
Figure from the GONG website
This is an image of the velocity inferred from the Doppler measurements. Top-bottom should be East-West; the gradient from red to blue is the signature of the Sun's rotation.
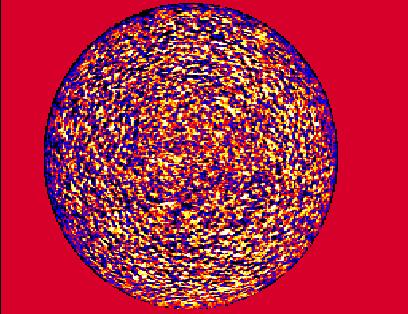
Figure from the GONG website
This is a velocity image after filtering to remove the Sun's rotation.
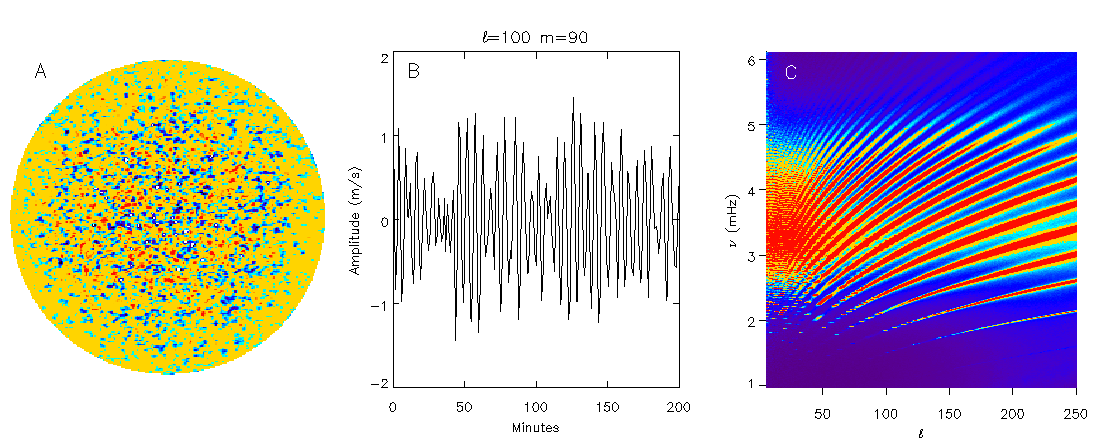 Figure from the GONG website. See Harvey, Hill, Hubbard, and 14 others, 1996,
Science, 272, 1284-1286. Schematic of the data processing
flow: time series of images like that on the left are each
decomposed into spherical harmonics, giving many time series of
spherical harmonics like that in the middle. The spectrum of each
of those time series is estimated, as a function of frequency.
The acoustic power as a function of the frequency and angular
wavenumber can then be estimated, as on the right.
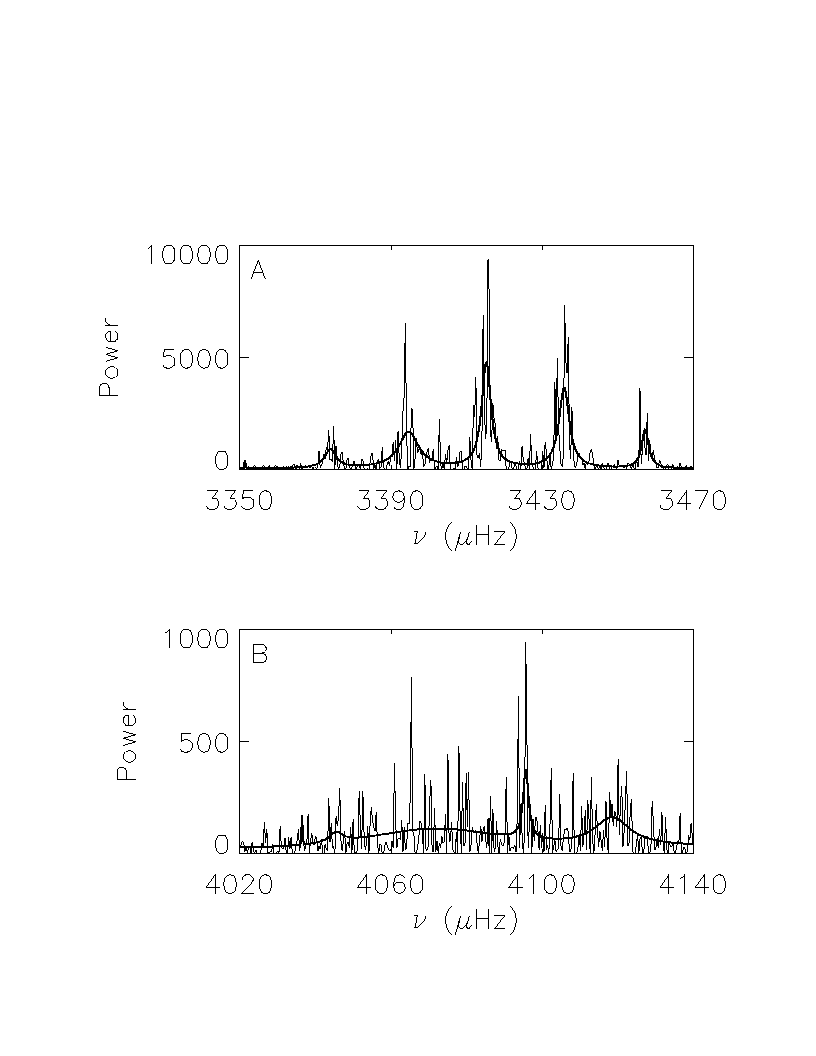
From GONG website. See Hill, Stark, Stebbins, and 23 others, 1996. Science, 272, 1292-1295. Examples of spectra well and poorly fitted by the parametric models used to estimate the frequency, amplitude, linewidth, and background power of solar modes.
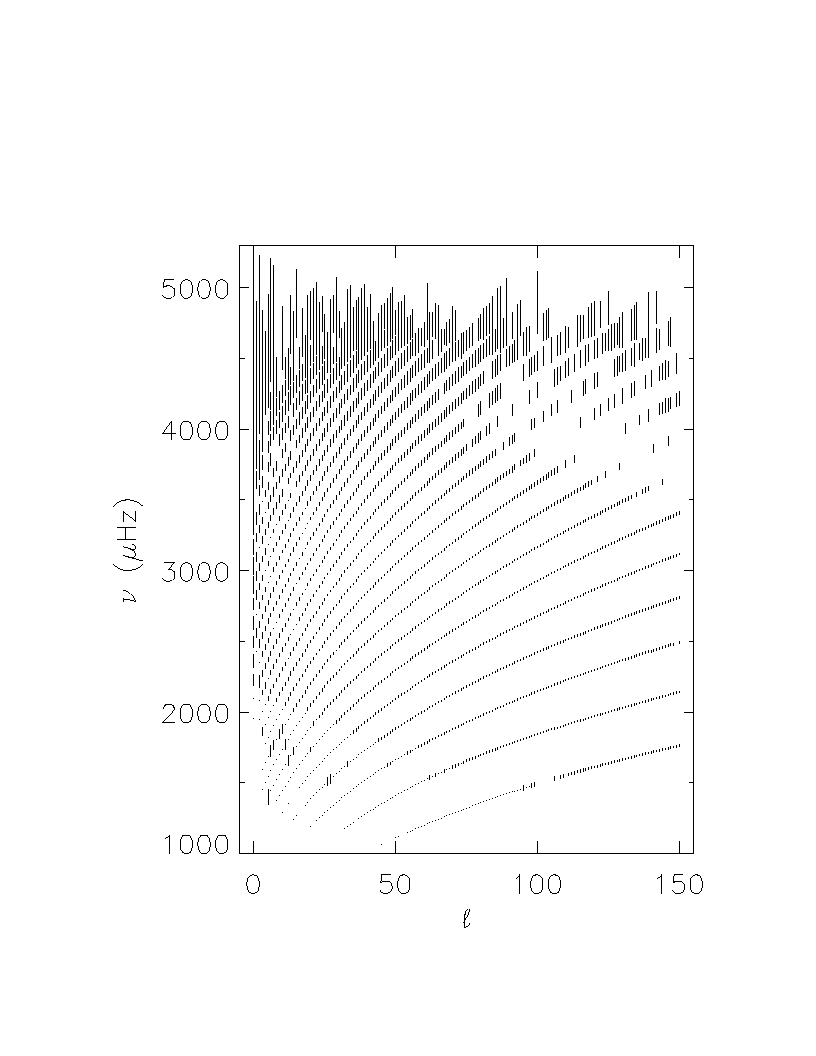
Figure from the GONG website. See Hill, Stark, Stebbins, and 23 others,
1996. Science, 272, 1292-1295. Central
frequencies of modes as a function of l, averaged over m,
with formal error bars magnified by 200.
Read tapes from sites.
Correct images for CCD characteristics (dark and clamp)
Transform intensities to Doppler velocities.
Calibrate velocities using daily calibration images*
Determine image geometry and modulation transfer function (from atmospheric effects, lens cleanliness, instrumental characteristics, etc.*
High-pass filtering to remove steady flows.
Remap images to heliographic coordinates, resample evenly in longitude and latitude using bicubic interpolation, correct for line-of-sight*
Transform to spherical harmonics: apply spatial window in heliographic coordinates, Legendre stack in latitude, FFT in longitude*.
Adjust the spherical harmonic amplitudes for the estimated modulation transfer function
Merge time series of spherical harmonic coefficients from different stations, using weights to account for relative uncertainties*
Fill data gaps of up to 30 minutes by autoregressive/moving average (ARMA) modeling*.
Take periodogram of the time series of spherical harmonic coefficients*.
Fit parametric model (Lorentzians plus background) to peaks in the power spectrum by iterative approximate maximum likelihood*.
Identify quantum numbers of the modes, report frequencies, linewidths, background power, and uncertainties*.
Asterisks (*) indicate steps that could be improved or possibly eliminated by better statistical methodology.
The two principal kinds of information one can extract from helioseismic data are spatial averages of the speed with which seismic waves travel in the Sun, and spatial averages of the speed with which parts of the Sun are moving relative to other parts (because the seismic waves are advected with the material). Until a few years ago, the features studied were global, and the studies were based on normal mode frequency estimates; more recently, scientists have started using "local area helioseismology" to image local features of the Sun, such as the flow beneath sunspots, using time series of images more directly.
These inference (inverse) problems are quite difficult, but they share mathematical and statistical structure with inverse problems in may fields, including geophysics and medical imaging.

Figure from the GONG website. See Thompson, Toomre, Anderson, and 26 others,
1996. Science, 272, 1300-1305. Left panel is an
estimate of the average rotation as a function of latitude and
radius using an approximate separation of latitude and radius in
the forward problem. Right panel is a regularized least-squares
model in a tensor-product basis, with second-derivative smoothing
and an arbitrary choice of Lagrange multiplier.

Figure from the GONG website. See Thompson, Toomre, Anderson, and 26 others, 1996. Science, 272, 1300-1305. Sections through the two-dimensional images above, at three latitudes. Shading is ±1SD(nominal).
Data Reduction and Calibration: how best to account for instrumental drifts, changes in lens cleanliness, etc.
Signal processing and spatial spectrum estimation.
Temporal spectrum estimation.
Parameteric spectrum fitting.
Inverse problems: nonparametric regression with indirect observations, imprecisely known forward operators, multidimensional regression functions; regularization and inference; unknown noise levels; plug-in bias estimates;...
Here are examples of some of the areas I'm familiar with in which new techniques are being developed and applied.
Spectrum estimation:
Spherical wavelet transformations for image denoising (Tenorio)
Multitaper spherical spectrum estimation, accounting for masking and noise (Fodor, Stark)
Gap-aware multitaper temporal spectrum estimates, and uncertainties for multitaper spectra via resampling (Fodor, Stark)
Wavelet shrinkage denoising of temporal power spectra (Gu, Komm, Stark)
Adaptive model selection in estimating spectral parameters (Anderson, Stark)
Combining cross-branch information using resampling (Fodor, Stark)
Inversion:
Minimax error estimates for rotation inversions incorporating prior physical constraints (Genovese, Gough, Stark, Thompson)
Estimates of the bias in regularized least-squares models (Genovese)
Multiple comparison procedures tailored to infer spatial variations in solar properties (Brown, Gough, Stark)
Construction of localized averages optimized for testing specific hypotheses (Gough, Sekii, Stark)
Nonparametric tests for the independence of excitation of different modes from combined time series (Fodor, Gough, Stark)
Accounting for forward model mis-specification in assessing the uncertainty in images (Stark)
Developing optimal estimators for linear functionals of restricted infinite-dimensional parameters (Stark)
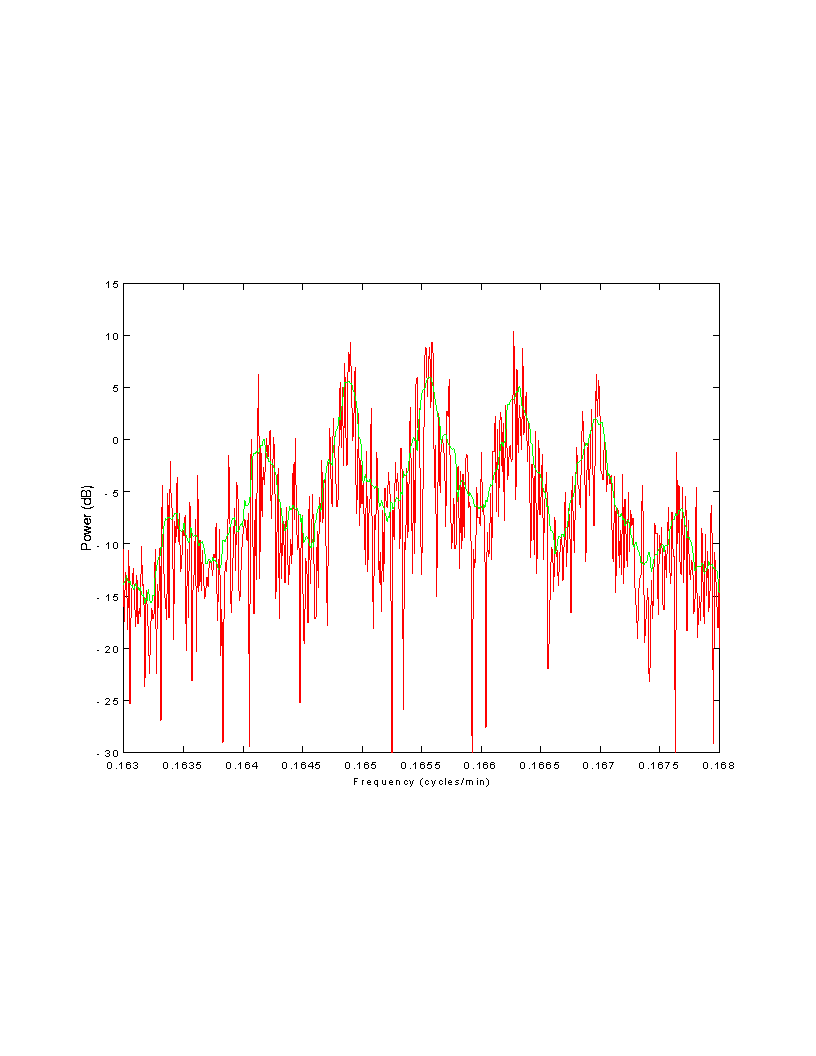
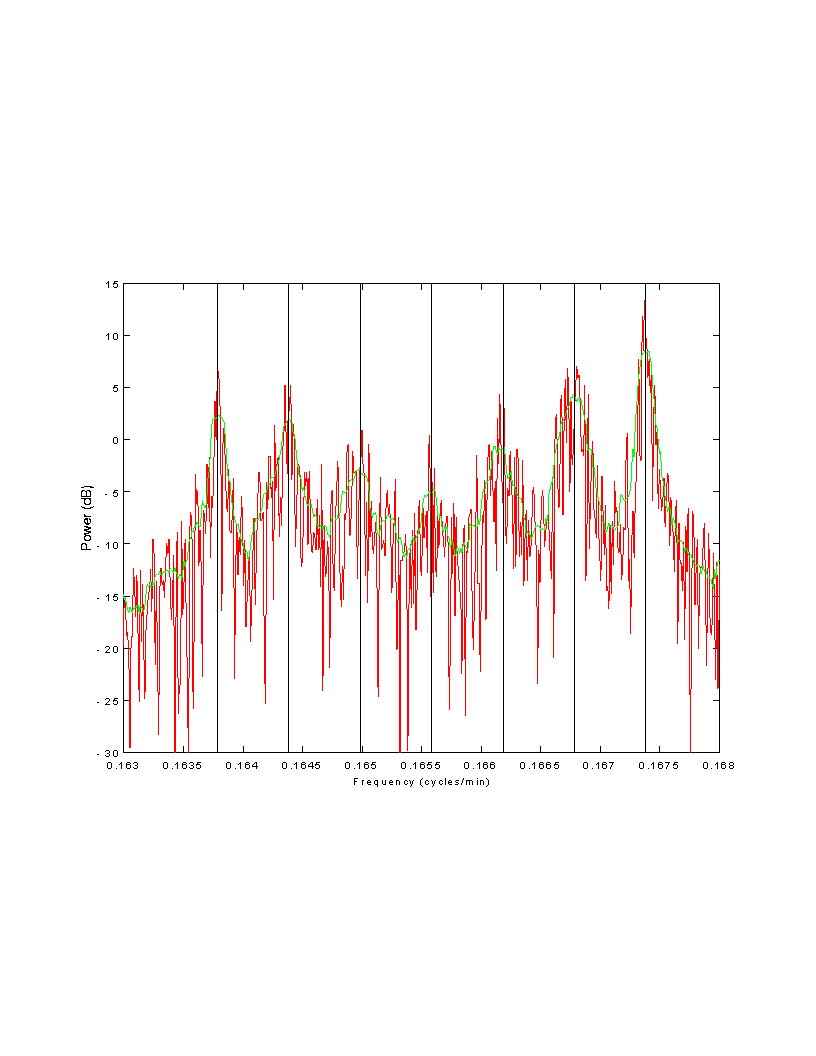
Periodogram (red) and gap-aware multitaper (green) estimates from
synthetic data, 25 modes.