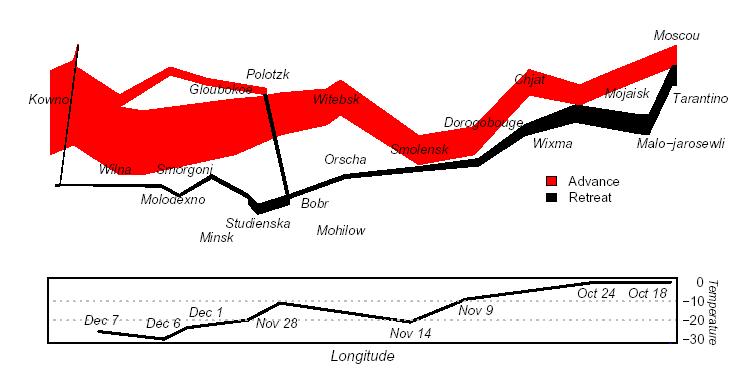
In Spring 2004, students were asked to replicate the Minard plot
Here is one student's plot
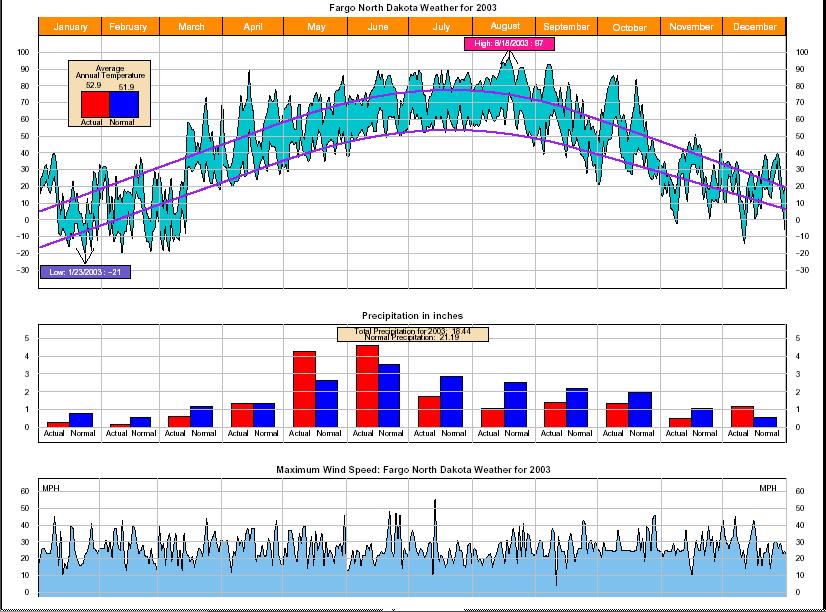
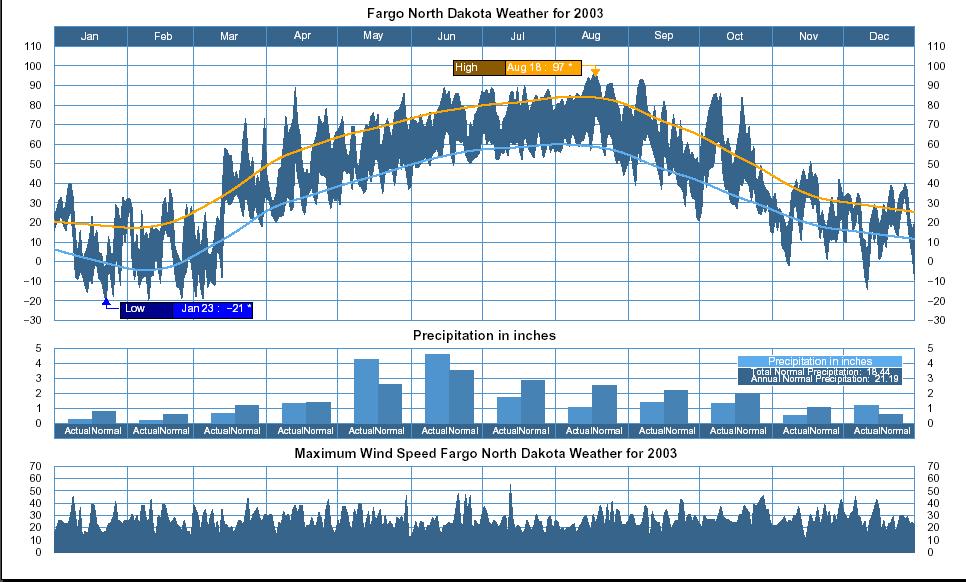
In Fall 2004, students were asked to replicate the NYC weather graphic using weather data from Fargo ND
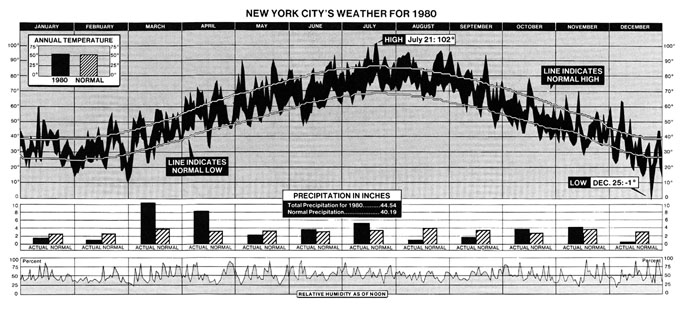
Here are two students' plots
They came up with some very creative ways to represent these data.
Here are three examples
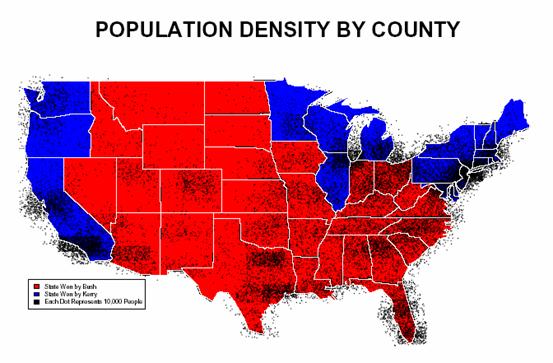
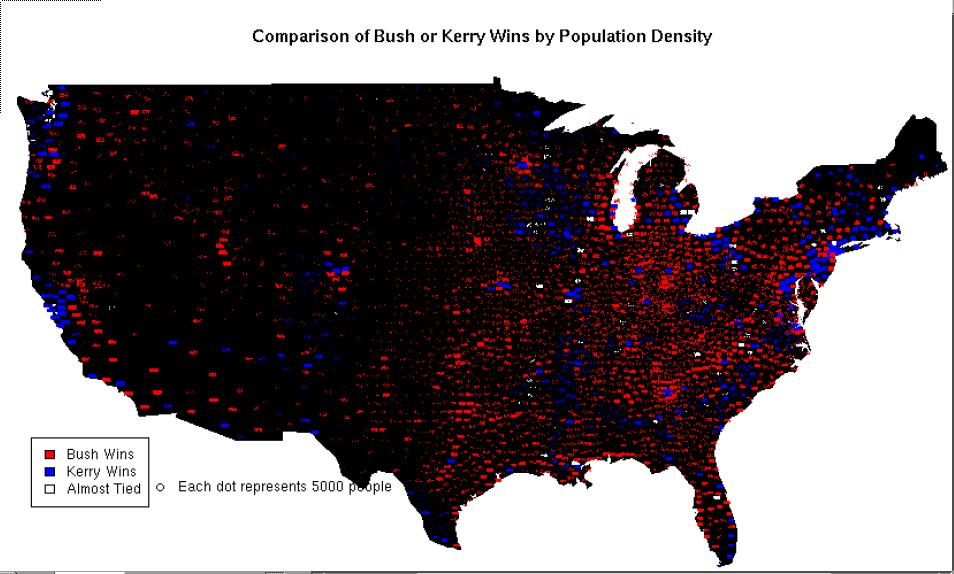

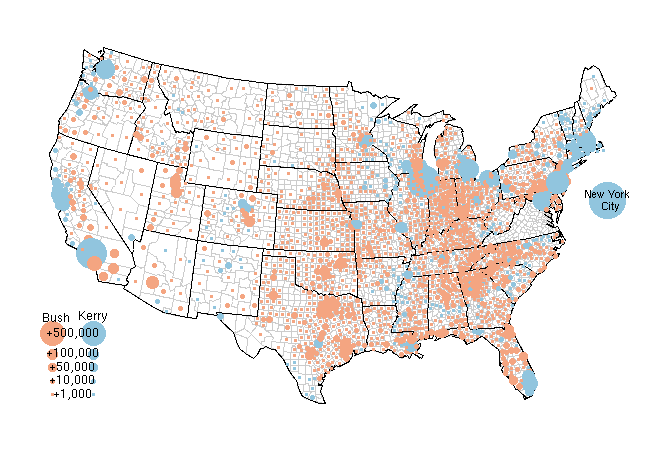
Finally, here is a start at the map for your project. Note that it is not complete, nor does it abide by all of the guides listed in the assignment. It is merely here to give you an idea as to what you can do.