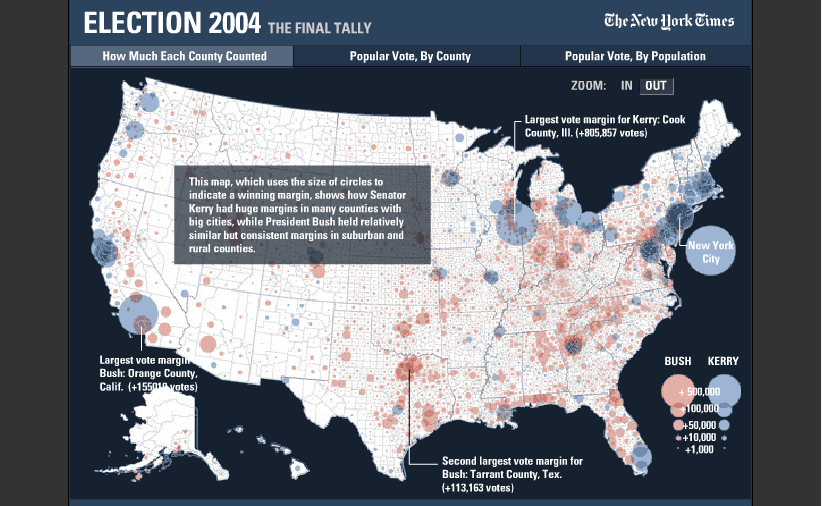
For the first mini-project, your assignment is to reproduce the following graphic that appeared in the New York Times. You are to turn in the plot and the code used to create the plot.
For your map of the United States, you have available to you the following data:
We use Wilkinson's grammar to describe the plot.
The functions rgb, hsv, gray and rainbow provide additional ways of generating colors.
The palette function alows you to set the palette of colors. Other color-related functions that may be of interest are colors palette palette colors(), terrain.color(), and col2rgb().
polys = function(mapObj) {
  n = length(mapObj$x)
# The polygon vertices are delimited by an NA entry
  breaks = which(is.na(mapObj$x))
  starts = c(1, breaks+1)
  ends = c(breaks -1, n)
  result = list()
  if (length(starts) == length(mapObj$names) ) {
      for (i in 1:length(starts)) {
        poly = matrix(c(mapObj$x[starts[i]:ends[i]],
                      mapObj$y[starts[i]:ends[i]]), ncol = 2, byrow = FALSE)
        result[[ mapObj$names[i] ]] = poly
      }
  }
  result
}
Note that the map package has a function to compute the centroid of a polygon given its vertices.
Also note that it is important to keep track of the counties and be sure that you properly match the data for a county with its county center.