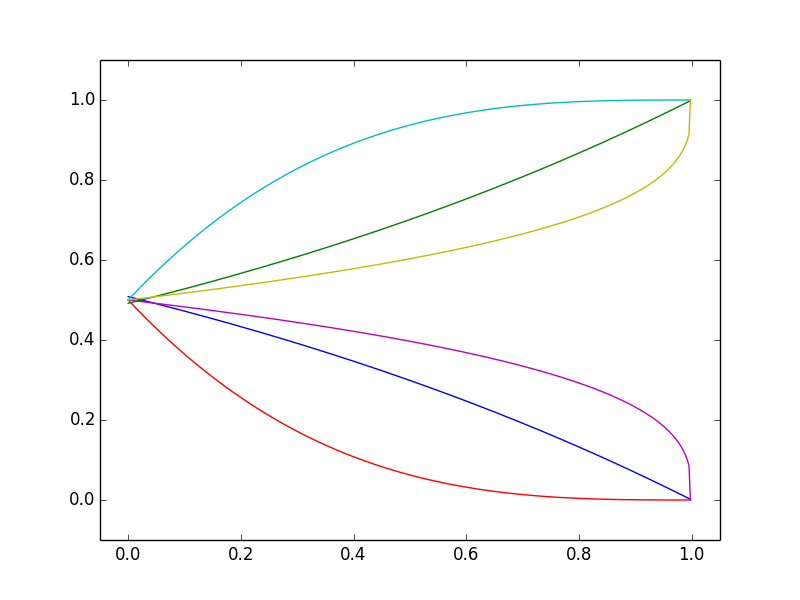
In such contexts one's intuition is that, as information slowly becomes available, the probability of a given outcome will slowly change in the correct direction. That is, in a given context we envisage that the curves showing how the probability will change with time under different plausible scenarios will be like the curves in the first figure. But this is just wrong. There is no setting in which it is mathematically possible that the representative realizations of how the probability changes with time can mostly look like the curves in the first figure.
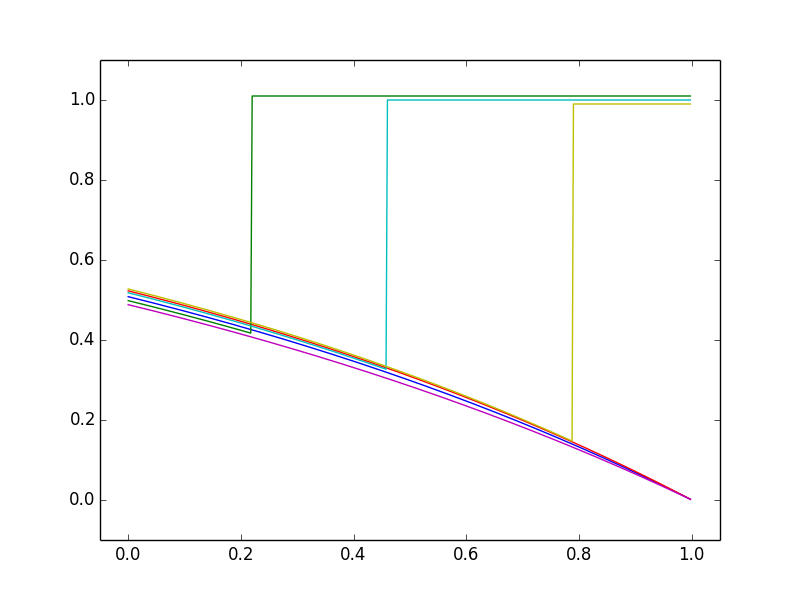
What can really happen is illustrated by the two "extreme" cases in the other figures. One case can be illustrated by the context of whether a major earthquake will occur in a given place before a given deadline (taken far ahead, so the current probability is 0.5). Assuming earthquakes remain unpredictable, the possible graphs of how the probability changes with time up to the deadline are shown in the second figure. Here one's intuition is correct: probabilities decrease as long as the earthquake hasn't happened, but jump to 1 if it does happen.
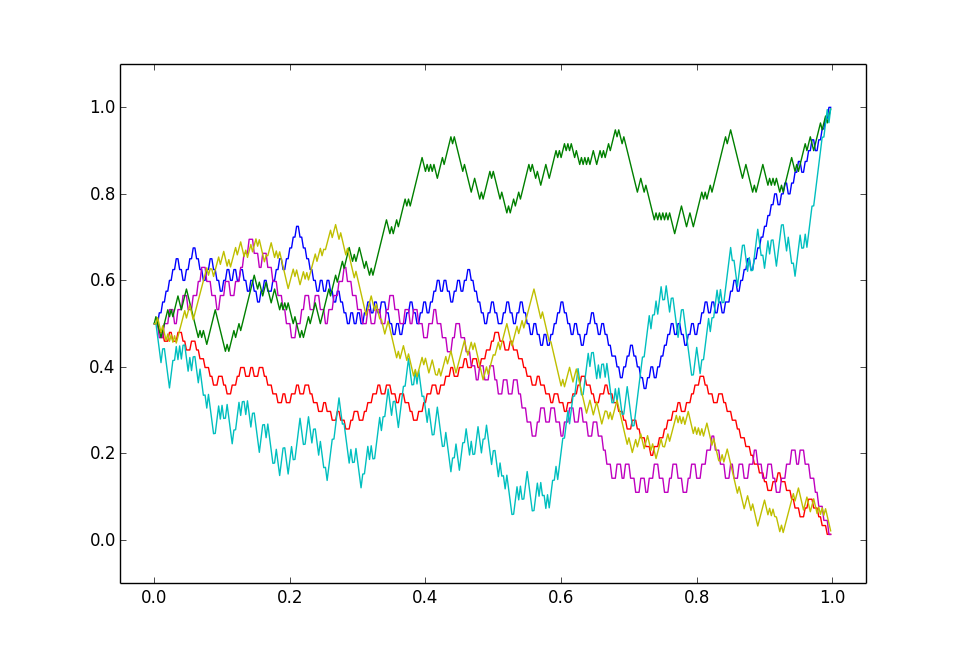
The third figure illustrates a third case, where new information only makes small changes to one's assessed probabilities. In this case the changes must vary in direction (up and down) which leads to the "jagged" curves in the third figure. This is reminiscent of stock market prices, which is no coincidence. Under the classical "rational" theory, stock prices reflect estimates of discounted future profits, which mathematically very similar to this "third case" context. Over longer time scales there are widely believed to also be various "irrational" effects -- investor optimism or pessimism, for instance -- but these overlay effects do not affect the qualitative picture of shorter term randomness.
The latter is itself a notable insight from mathematical probability. The characteristic jagged shape of stock prices is not specific to the context of stocks or finance, but is a general feature of slowly varying assessments of likelihoods of future events.
To reiterate an earlier point, if one sees some estimated probability of a future event increasing from 50% to 60% to 70% then one might presume that it is next likely to increase to 80% rather than decrease to 60%. Such a presumption of trend is often sensible for data from an observed real-world process (economic data etc) but this "left figure" or trend effect presumption is just wrong for probabilities. See this 2018 technical paper for references to the academic literature on this aspect of risk perception.
The underlying math fact here is (roughly speaking) that realizations of any martingale must look like some combination of those in the second or third figures. This is implicit in results from martingale theory but hard to discern in textbooks.