Arc Sine laws and stock prices
In a graduate course in probability we give the three arc sine laws for Brownian motion
(B(t), 0 < t < 1), which say that the following three random variables have arc sine
(Beta(1/2,1/2)) distribution.
-
length of time t that B(t) > 0
- last time t that B(t) = 0
- time t that B(t) attains its maximum.
So the usual random walk/Brownian motion models for stock market prices,
looked at over a short period, predict that the analogous statistics should follow the arc sine law.
Ideally one should look at intra-day prices for each of say 1,000 days.
This data is not so easily available; instead we show plots (made by Gah-Yi Vahn in May 2009)
giving daily closing S&P500 values for non-overlapping 20-day blocks
(there were 746 blocks).
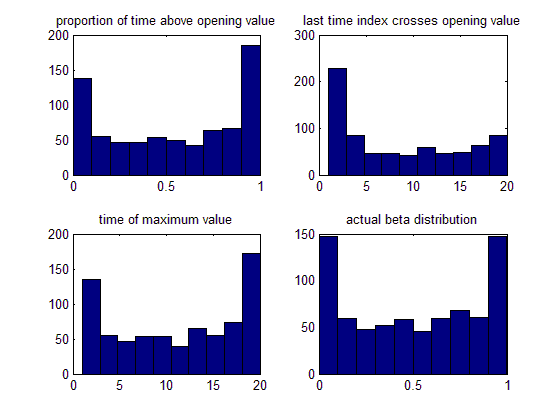
Because the model is really a 20-step random walk, not Brownian motion, there are discretization effects.
A better comparison of the data above is with a simulation of the random walk, shown below.
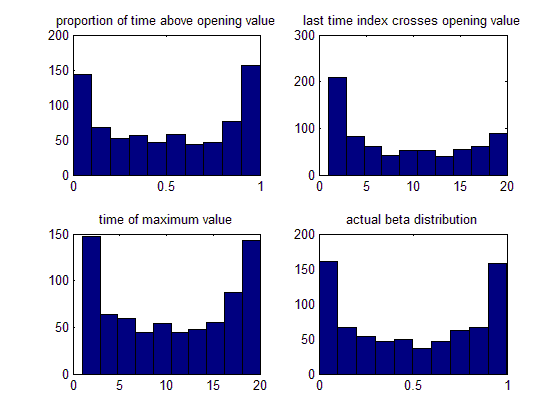
Ignoring the beta plots, for the 3 statistics the data fits the model simulations pretty well.
Note that the discretization effect (deviation from beta) is most noticable for the statistic
- T = last time t that B(t) = 0
and in retrospect this is easy to explain.
If B(19/20) is close to 0 then it's very likely that T > 19/20 but only has
chance about 1/2 that B(1) > 0, whch is needed for the discretization of T to be 1.
So the height of the rightmost bar in the histogram for T should be only about 1/2 of
the height of the leftmost bar, and that's what we see in data and the model.
Why this example?
These arc sine laws are both counter-intuitive and non-elementary -- they are not just
simple consequences of "fair bet" or "IID sums" -- and there's no way you would predict this behavior except using the specific probability model.