Graphical User Interfaces
1 Graphical User Interfaces
While using R through the command line provides a great deal of flexibility,
there are times when a simpler interface would be useful. For example, you
may develop an R program that performs a complex analysis, and you'd like
others to be able to run the program by, say just specifying a file to be
read, and choosing a couple of options through checkboxes or a drop down
list. There may be a set of operations that your routinely do when first
studying a data set, and you'd like to be presented with a list of available
data, and just click on the one that you want.
There are several different options available in R to produce graphical user
interfaces (GUIs); we are going to focus on a simple, portable one based on
the Tcl/Tk library originally developed by John Ousterhout when he was in the
Computer Science department here at Berkeley. Tcl is a scripting language
(like perl or python), and Tk is a graphical toolkit designed to work with that
language. Since the Tk toolkit is portable, easy-to-use, and provides most of
the basic elements needed to create GUIs, interfaces to it are available in many
languages, so if you understand the basics of Tk GUIs, you may see the same techniques
used later on in your career by some other program. To use the Tcl/Tk library in R,
you must load the library with the library(tcltk) command. This library is
part of the base R distribution, so you don't have to download anything in order to
use it (although you may choose to download some optional components later on.)
If you look at the help pages for the functions in the tcltk library, you'll
probably be surprised to see how little information or guidance there is. However,
once you work with the library for a while, you'll get accustomed to the way Tk functions
are mapped to R functions, and you'll be able to use any documentation about Tk that you
can find on the web or elsewhere to get more information. There are a wide variety of
sample programs at http://bioinf.wehi.edu.au/ wettenhall/RTclTkExamples/, but they use a different geometry method and
some require external packages. I'll try to provide examples here to help you get
started, but don't hesitate to look around the web for more examples and ideas.
The process of creating a GUI can be broken down into two parts: choosing the elements
(often refered to as widgets) that will make up the GUI, and arranging for the elements
to be placed in the appropriate positions and displayed. This second step is sometimes
known as geometry management. Tk actually offers several different geometry management
methods; we are going to focus on one known as packing. In the packing geometry model,
the GUI is considered a collection of separate frames, each containing some of the
widgets that make up the final GUI. The widgets are loaded into the frames in a
carefully chosen order, and they "spread out" to fill the frame. When you pack a
widget into a frame, you can specify the side to which to pack it, choosing among
left, right, top or bottom. With a little practice
and experimentation, you can usually get the widgets to line up the way you want them
to.
Most of the widgets that are available through the Tk toolbox should look familiar, as
common applications like email clients and web browser use these same elements in their
GUIs. Some examples of available widgets are:
- text entry fields
-
drop down menus
-
check buttons
-
radio buttons
-
file selection browsers
-
sliding scales
Since the Tk toolbox is not integrated entirely into R, it's necessary to use special
techniques to get information out of the Tcl/Tk environment and into R. Many of the
widgets, for example a text entry widget, will need a Tcl variable associated with
them to hold necessary information. All of the variables that will be captured by
the GUI will be character variables. The tclVar function can be used to create
an empty tcl variable which can then be used in call to functions in the tcltk
library as follows:
myvar = tclVar('')
Later, when you need to get the information that was put into the Tk variable back into
the R environment, you can use the tclvalue function:
rmyvar = tclvalue(myvar)
Another aspect of GUI programming that is different from regular programs has to do with
associating actions with certain GUI elements. An obvious example is a button, which
when pressed needs to do something. Widgets like this will have an argument, usually
called command= which will accept the name of a function that will be called when
the button (or other action) is recognized. Such functions, often called callbacks,
should be written using the ... notation for their argument lists, and should
not have any returned values. It sometimes
becomes necessary to "remember" things over the course of a GUI's execution. For example,
you may want to count the number of times a button is pressed, or display a different
message based on the value of a previous response. Since all of the actions which the
GUI will initiate are carried out in functions, any modifications to variables that are
made in those functions will be lost when the function returns. While not usually a good
practice, you can use the special assignment operator <<- inside a function to
modify global variables, which will retain their values after the function exits.
To make some of these concepts clearer, let's consider the construction of a GUI to
accept input to the coin.power program that we developed earlier. Recall
that the program accepts the number of simulations, number of coin tosses, probability
of getting heads for the coin, and returns the power. We want to make a GUI with
three entries, one for each of the parameters, a place to display the answer, and
buttons to run the simulation or close the window. The first step in creating a GUI with
the tcltk library in R is loading the library and calling the tktoplevel
function, which creates an initial window into which we will pack the frames containing
the widgets. Since we can control the order of packing into individual frames, each
set of related elements can be put into a separate frame. For this example, we'll create
a separate frame for each entry and its associated label, as well as a frame to hold
those entries and another frame for the
two buttons; the area for the answer can be packed into the toplevel frame.
In the code that follows, you'll notice that usually widgets are packed directly into
their enclosing frames, but the label widget that will hold the answer is assigned to
a variable before being
packed. If you'll need to communicate with the widget at some point in the running of
the program, it's vital to store the widget in a variable. In this example, we'll
create a blank label, and use the tkconfigure function when we have an answer
to change what the label displays. Here's the code to create the GUI:
require(tcltk)
coin.power = function(ntoss=100,nsim=1000,prob=.5){
     lower = qbinom(.025,ntoss,.5)
     upper = qbinom(.975,ntoss,.5)
     rr = rbinom(nsim,ntoss,prob)
     sum(rr < lower | rr > upper) / nsim
 }

destroy = function(...)tkdestroy(base)

tst = function(...){
   nsim = as.numeric(tclvalue(nsim_))
   ntoss = as.numeric(tclvalue(ntoss_))
   prob  = as.numeric(tclvalue(prob_))
   res = coin.power(ntoss=as.numeric(ntoss),nsim=as.numeric(nsim),prob=as.numeric(prob))
   tkconfigure(ans,text=paste(res))
}

base = tktoplevel()
tkwm.title(base,'Coin Toss')

# create a frame to hold the three entries
nfrm = tkframe(base)

# create tcl variables to associate with the
# entry fields -- to include starting values
# replace the '' with the desired value
nsim_ = tclVar('')
ntoss_ = tclVar('')
prob_ = tclVar('')

f1 = tkframe(nfrm)
tkpack(tklabel(f1,text='Nsim',width=8),side='left')
tkpack(tkentry(f1,width=10,textvariable=nsim_),side='left')

f2 = tkframe(nfrm)
tkpack(tklabel(f2,text='Ntoss',width=8),side='left')
tkpack(tkentry(f2,width=10,textvariable=ntoss_),side='left')

f3 = tkframe(nfrm)
tkpack(tklabel(f3,text='Prob',width=8),side='left')
tkpack(tkentry(f3,width=10,textvariable=prob_),side='left')

# the widgets were packed in the frames, but the frames have
# not yet been packed.  Remember that nothing can actually be
# displayed unless it's been packed.
tkpack(f1,side='top')
tkpack(f2,side='top')
tkpack(f3,side='top')

tkpack(nfrm)

# now we can repeat the process for the label to hold the
# answer, and the frame containing the buttons
ans = tklabel(base,text=' ')
tkpack(ans,side='top')

bfrm = tkframe(base)
tkpack(tkbutton(bfrm,text='Run',command=tst),side='left')
tkpack(tkbutton(bfrm,text='Quit',command=destroy),side='right')

tkpack(bfrm,side='bottom')
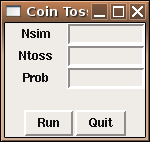
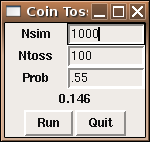
When we run the program (for example by using the source command
inside of R), we see the left hand image; after making some entries and hitting
the Run button, we see the image on the right.
2 Appearance of Widgets
The previous example was a very minimalistic approach, with no
concern with the actual appearance of the final product. One simple
way to improve the appearance is to add a little space around the
widgets when we pack them. The tkpack function accepts two
arguments, padx= and pady= to control the amount of
space around the widgets when they are packed. Each of these arguments
takes a scalar or a vector of length 2. When a scalar is given, that much
space (in pixels) is added on either side of the widget in the specified
dimension. When a list is given the first number is the amount of space
to the left (padx) or the top (pady), and the second
number is the amount of space to the right (padx) or the bottom
(pady). Like most aspects of GUI design, experimentation is
often necessary to find the best solution. The following code produces
a version of the coin power GUI with additional padding:
base = tktoplevel()
tkwm.title(base,'Coin Toss')

nfrm = tkframe(base)

nsim_ = tclVar('')
ntoss_ = tclVar('')
prob_ = tclVar('')

f1 = tkframe(nfrm)
tkpack(tklabel(f1,text='Nsim',width=8),side='left',pady=c(5,10))
tkpack(tkentry(f1,width=10,textvariable=nsim_),side='left',padx=c(0,20),pady=c(5,10))

f2 = tkframe(nfrm)
tkpack(tklabel(f2,text='Ntoss',width=8),side='left',pady=c(5,10))
tkpack(tkentry(f2,width=10,textvariable=ntoss_),side='left',padx=c(0,20),pady=c(5,10))

f3 = tkframe(nfrm)
tkpack(tklabel(f3,text='Prob',width=8),side='left',pady=c(5,10))
tkpack(tkentry(f3,width=10,textvariable=prob_),side='left',padx=c(0,20),pady=c(5,10))

tkpack(f1,side='top')
tkpack(f2,side='top')
tkpack(f3,side='top')

tkpack(nfrm)

ans = tklabel(base,text=' ')
tkpack(ans,side='top')

bfrm = tkframe(base)
tkpack(tkbutton(bfrm,text='Run',command=tst),side='left')
tkpack(tkbutton(bfrm,text='Quit',command=destroy),side='right')

tkpack(bfrm,side='bottom',pady=c(0,10))
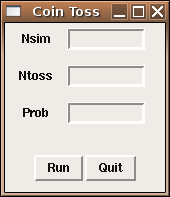
Here are side-by-side pictures showing the difference between the two
versions:
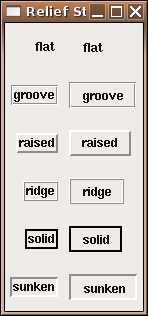
Another way to modify a GUI's appearance is through three-dimensional
effects. These are controlled by an argument called relief=,
which can take values of "flat", "groove", "raised",
"ridge", ßolid", or ßunken".
The following code produces a (non-functioning) GUI showing the different
relief styles applied to labels and buttons:
require(tcltk)
types = c('flat','groove','raised','ridge','solid','sunken')

base = tktoplevel()
tkwm.title(base,'Relief Styles')

frms = list()

mkframe = function(type){
    fr = tkframe(base)
    tkpack(tklabel(fr,text=type,relief=type),side='left',padx=5)
    tkpack(tkbutton(fr,text=type,relief=type),side='left',padx=5)
    tkpack(fr,side='top',pady=10)
    fr
}

sapply(types,mkframe)
Here's a picture of how it looks:
3 Fonts and Colors
Several arguments can be used to modify color. The background=
argument controls the overall color, while the foreground= argument
controls the color of text appearing in the widget. (Remember that things
like this can be changed while the GUI is running using the tkconfigure
command. Each of these arguments accepts colors spelled out (like
"lightblue", "red", or "green") as well as
web-style hexadecimal values (like "#add8e6", "#ff0000" or
"#00ff00").
To change from the default font (bold Helvetica), you must first create
a Tk font, using the tkfont.create function. This function takes
a number of arguments, but only the font family is required.
The available font families will vary from platform to platform; the
tkfont.families() command will display a list of the available
fonts. Some of the other possible arguments to tkfont.create
include:
- size=, the size of the font in points.
-
weight=, either "normal" or "bold"
-
slant=, either "roman" or ïtalic"
-
underline=, either TRUE or FALSE
-
overstrike=, either TRUE or FALSE
As mentioned earlier, colors can be specified as either names or web-style
hexadecimal values. Generally, the argument to change the color of a
widget is background=; the argument to change the color of any
text appearing in the widget is foreground=. If these choices don't
do what you expect, you may need to check the widget-specific documentation.
Here's a simple program that chooses some randomly selected colors and fonts,
and displays them as labels.
require(tcltk)

somefonts = c('utopia','freemono','lucidatypewriter','mukti',
'{new century schoolbook}','freeserif','times','newspaper','freesans')

somecolors = c('red','blue','green','yellow','lightblue','tan',
'darkred','lightgreen','white')

txt = 'ABCDEFGHIJKLMNOPQRSTUVWXYZabcdefghijklmnopqrstuvwxyz'

base = tktoplevel()
tkwm.title(base,'Fonts')
mkfonts = function(font,color){
      thefont = tkfont.create(family=font,size=14)
      tkpack(tklabel(base,text=paste(font,':',txt),
                    font=thefont,background=color),
                    side='top')
}

mapply(mkfonts,somefonts,somecolors)
Here's how it looks:
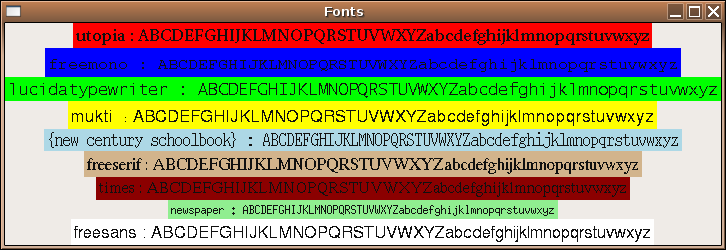 Note that only the specific widget for which background= was set
changes - if you want to change the background for the entire GUI, you'll
probably have to pass the background= argument to every widget you
use.
Note that only the specific widget for which background= was set
changes - if you want to change the background for the entire GUI, you'll
probably have to pass the background= argument to every widget you
use.
4 Plotting
When developing a TK-based GUI for plotting, there are two possibilities available.
The first, which is the only choice if you need to interact with the graph using
locator or identify, is to create a GUI with the controls for the
plot, and to let R open a normal plotting window. The second option utilizes the
tkrplot library, available from CRAN, to create a label widget with an image
of the plot; this label can be placed anywhere that any other widget can be placed.
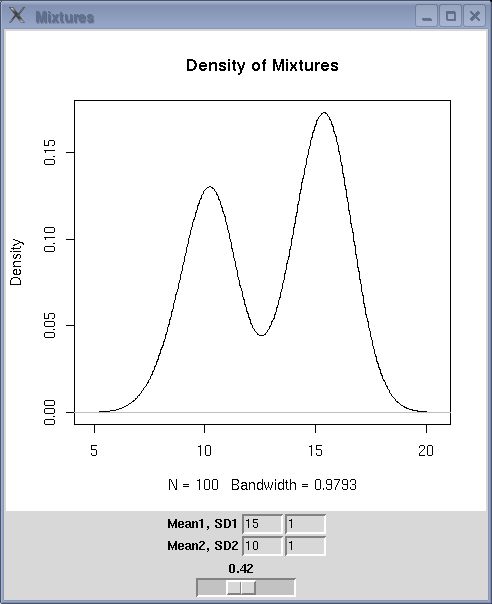
To illustrate the use of a GUI with plotting, consider
the problem of mixtures of normal distributions. Many times a sample will
actually contain
two separate distributions, even though it will be treated as a single distribution.
Obviously data like this will create problems when we try to analyze it, so it's
important to be able to recognize such data, using, say a density plot. To get
an idea of how the density of mixtures of distributions would look, we can create
a GUI using a scale or slider widget that will allow us to control the fraction
of each of two distributions that will be combined. Many times the first step
in making a GUI is writing the function that the GUI will eventually call to
actually do the work. This helps to identify the parameters that need to be
supplied to the function so that the GUI can be designed in such a way to get all
the necessary information. For this case, we'll want to specify the mean and
standard deviation of the first distribution, the mean and standard deviation of
the second distribution, and the fraction of the second distribution to use. (The
fraction for the first distribution will just be 1 minus the fraction for the
first distribution.) Here's such a function:
genplot = function(m1,s1,m2,s2,frac,n=100){
     dat = c(rnorm((1-frac)*n,m1,s1),rnorm(frac*n,m2,s2))
     plot(density(dat),type='l',main='Density of Mixtures')
}
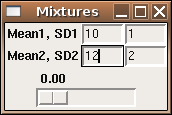
Now we can create the interface. We'll make three frames: the first will accept
the mean and standard deviation for the first distribution, the second will have
the mean and standard deviation for the second distribution, and the third will
have the slider to determine the fraction of each distribution to use. Recall that
we need to create tcl variables, and then convert them into R variables
before we can call our function, so I'll use an intermediate function which will
do the translations and then call genplot as a callback. Although there
is a fair amount of code, most of it is very similar.
require(tcltk)

doplot = function(...){
   m1 = as.numeric(tclvalue(mean1))
   m2 = as.numeric(tclvalue(mean2))
   s1 = as.numeric(tclvalue(sd1))
   s2 = as.numeric(tclvalue(sd2))
   fr = as.numeric(tclvalue(frac))
   genplot(m1,s1,m2,s2,fr,n=100)
}

base = tktoplevel()
tkwm.title(base,'Mixtures')
mainfrm = tkframe(base)

mean1 = tclVar(10)
mean2 = tclVar(10)
sd1   = tclVar(1)
sd2   = tclVar(1)
frac  = tclVar(.5)

m1 = tkframe(mainfrm)
tkpack(tklabel(m1,text='Mean1, SD1',width=10),side='left')
tkpack(tkentry(m1,width=5,textvariable=mean1),side='left')
tkpack(tkentry(m1,width=5,textvariable=sd1),side='left')
tkpack(m1,side='top')

m2 = tkframe(mainfrm)
tkpack(tklabel(m2,text='Mean2, SD2',width=10),side='left')
tkpack(tkentry(m2,width=5,textvariable=mean2),side='left')
tkpack(tkentry(m2,width=5,textvariable=sd2),side='left')
tkpack(m2,side='top')

m3 = tkframe(mainfrm)
tkpack(tkscale(m3,command=doplot,from=0,to=1,showvalue=TRUE,
               variable=frac,resolution=.01,orient='horiz'))
tkpack(m3,side='top')

tkpack(mainfrm)
Here's how the interface looks:
 To produce the same sort of GUI, but with the plot in the same frame as the
slider, we can use the tkrplot library. To place the plot in the
same frame as the slider, we must first create a tkrplot widget, using
the tkrplot function. After loading the tkrplot library,
we call this function with two arguments; the frame in which the plot is to
be displayed, and a callback function (using ... as the only argument)
that will draw the desired plot. In this example, we can use the same function
(doplot) as in the standalone version:
To produce the same sort of GUI, but with the plot in the same frame as the
slider, we can use the tkrplot library. To place the plot in the
same frame as the slider, we must first create a tkrplot widget, using
the tkrplot function. After loading the tkrplot library,
we call this function with two arguments; the frame in which the plot is to
be displayed, and a callback function (using ... as the only argument)
that will draw the desired plot. In this example, we can use the same function
(doplot) as in the standalone version:
img = tkrplot(mainfrm,doplot)
Since the tkrplot widget works by displaying an image of the
plot, the only way to change the plot is to change this image, which is exactly
what the tkrreplot function does. The only argument to tkrreplot
is the tkrplot widget that will need to be redrawn. Thus, the slider
can be constructed with the following statements:
scalefunc = function(...)tkrreplot(img)
s = tkscale(mainfrm,command=scalefunc,from=0,to=1,showvalue=TRUE,
               variable='frac',resolution=.01,orient='horiz')
By packing the tkrplot object first, followed by the frames for the mean
and standard deviations, and packing the slider widget last, we can produce the
GUI shown below:
 The complete code for this GUI is as follows:
require(tcltk)
require(tkrplot)

genplot = function(m1,s1,m2,s2,frac,n=100){
     dat = c(rnorm((1-frac)*n,m1,s1),rnorm(frac*n,m2,s2))
          plot(density(dat),type='l',main='Density of Mixtures')
	  }

doplot = function(...){
   m1 = as.numeric(tclvalue(mean1))
   m2 = as.numeric(tclvalue(mean2))
   s1 = as.numeric(tclvalue(sd1))
   s2 = as.numeric(tclvalue(sd2))
   fr = as.numeric(tclvalue(frac))
   genplot(m1,s1,m2,s2,fr,n=100)
}


base = tktoplevel()
tkwm.title(base,'Mixtures')
mainfrm = tkframe(base)

mean1 = tclVar(10)
mean2 = tclVar(10)
sd1   = tclVar(1)
sd2   = tclVar(1)
frac  = tclVar(.5)

img = tkrplot(mainfrm,doplot)
scalefunc = function(...)tkrreplot(img)
s = tkscale(mainfrm,command=scalefunc,from=0,to=1,showvalue=TRUE,
               variable=frac,resolution=.01,orient='horiz')
tkpack(img)

m1 = tkframe(mainfrm)
tkpack(tklabel(m1,text='Mean1, SD1',width=10),side='left')
tkpack(tkentry(m1,width=5,textvariable=mean1),side='left')
tkpack(tkentry(m1,width=5,textvariable=sd1),side='left')
tkpack(m1,side='top')
m2 = tkframe(mainfrm)
tkpack(tklabel(m2,text='Mean2, SD2',width=10),side='left')
tkpack(tkentry(m2,width=5,textvariable=mean2),side='left')
tkpack(tkentry(m2,width=5,textvariable=sd2),side='left')
tkpack(m2,side='top')

tkpack(s)

tkpack(mainfrm)
5 Binding
For those widgets that naturally have an action or variable associated
with them, the Tk interface provides arguments like textvariable=,
or command= to make it easy to get these widgets working as they
should. But we're not limited to associating actions with only those
widgets that provide such arguments. By using the tkbind command,
we can associate a function (similar to those accepted by functions
that use a command= argument) to any of a large number of possible
events. To indicate an event, a character string with the event's name
surrounded by angle brackets is used. The following table shows some of
the actions that can have commands associated with them. In the table,
a lower case x is used to represent any key on the keyboard.
| <Return> | <FocusIn> |
| <Key-x> | <FocusOut> |
| <Alt-x> | <Button-1>, <Button-2>, etc. |
| <Control-x> | <ButtonRelease-1>, <ButtonRelease-2>, etc. |
| <Destroy> | <Double-Button-1>, <Double-Button-2> , etc. |
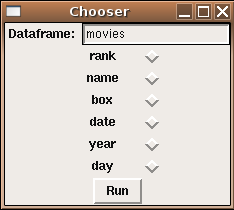
As an example, suppose we wish to create a GUI that will allow the user to
type in the name of a data frame, and when the user hits return in the
entry field, a set of radio buttons, one for each variable in the data
frame, will open up below the entry field. Finally, a button will allow
for the creation of a histogram from the selected variable.
require(tcltk)

makehist = function(...){
   df = get(tclvalue(dfname))
   thevar = tclvalue(varname)
   var = as.numeric(df[[thevar]])
   hist(var,main=paste("Histogram of",thevar),xlab=thevar)
}

showb = function(...){
    df = get(tclvalue(dfname))
    vars = names(df)
    frms = list()
    k = 1

    mkframe = function(var){
        fr = tkframe(base)
        tkpack(tklabel(fr,width=15,text=var),side='left')
        tkpack(tkradiobutton(fr,variable=varname,value=var),side='left')
        tkpack(fr,side='top')
        fr
    }

    frms = sapply(vars,mkframe)

    tkpack(tkbutton(base,text='Run',command=makehist),side='top')
}

base = tktoplevel()
tkwm.title(base,'Chooser')

dfname = tclVar()
varname = tclVar()

efrm = tkframe(base)

tkpack(tklabel(efrm,text='Dataframe: '),side='left')
dfentry = tkentry(efrm,textvariable=dfname,width=20)
tkbind(dfentry,'<Return>',showb)
tkpack(dfentry,side='left')
tkpack(efrm)
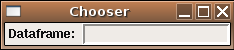
Here's a picture of the widget in both the "closed" and "open" views:
6 Opening Files and Displaying Text
While it would be very simple (and not necessarily a bad idea) to use an
entry field to specify a file name, the Tk toolkit provides a file browser
which will return the name of a file which a user has chosen, and will usually
be a better choice if you need to open a file.
Another issue that arises has to do with displaying output. If the output is
a plot, it's simple to just open a graph window; if the output is text, you
can just print it in the normal way, and it will display in the same place
as you typed the R command to display the GUI. While this is useful while
debugging your program, if there are printed results they should usually be
displayed in a separate window. For this purpose, Tk provides the
tktext object. To display output in this way, we can use the
capture.output function, which takes the output of any R command
and, instead of displaying it to the screen, stores the output in a
vector of character values.
Alternatively,
the output could be written to a file,
then read back into a character vector.
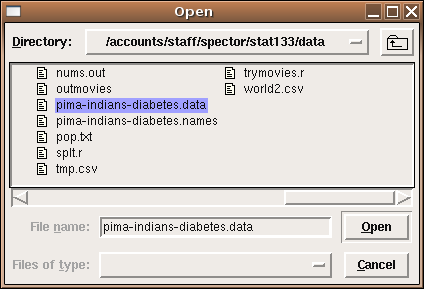
The following example program invokes tkgetOpenFile to get the name of a file
to be opened; it then opens the file, reads it as a CSV file and displays the
results in a text window with scrollbars. The wrap='none' argument
tells the text window not to wrap the lines; this is appropriate when you have
a scrollbar in the x-dimension. Finally, to give an idea of how the text
window can be modified, a button is added to change the text window's display
from the listing of the data frame to a data frame summary.
require(tcltk)

summ = function(...){
   thestring = capture.output(summary(myobj))
   thestring = paste(thestring,collapse='\n')
   tkdelete(txt,'@0,0','end')
   tkinsert(txt,'@0,0',thestring)
}

fileName<-tclvalue(tkgetOpenFile())

myobj = read.csv(fileName)

base = tktoplevel()
tkwm.title(base,'File Open')
yscr <- tkscrollbar(base,
                       command=function(...)tkyview(txt,...))
xscr <- tkscrollbar(base,
                       command=function(...)tkxview(txt,...),orient='horiz')
txt <- tktext(base,bg="white",font="courier",
	     yscrollcommand=function(...)tkset(yscr,...),
	     xscrollcommand=function(...)tkset(xscr,...),
	     wrap='none',
	     font=tkfont.create(family='lucidatypewriter',size=14))


tkpack(yscr,side='right',fill='y')
tkpack(xscr,side='bottom',fill='x')
tkpack(txt,fill='both',expand=1)

tkpack(tkbutton(base,command=summ,text='Summary'),side='bottom')

thestring = capture.output(print(myobj))
thestring = paste(thestring,collapse='\n')
tkinsert(txt,"end",thestring)
tkfocus(txt)
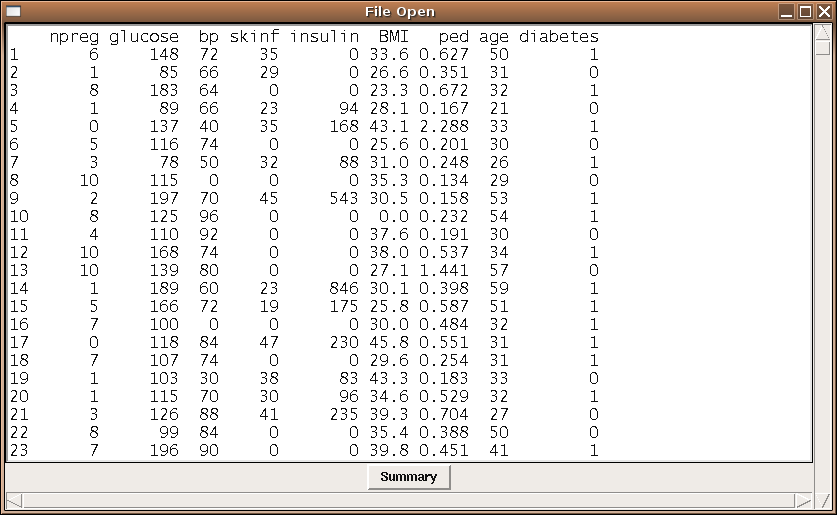
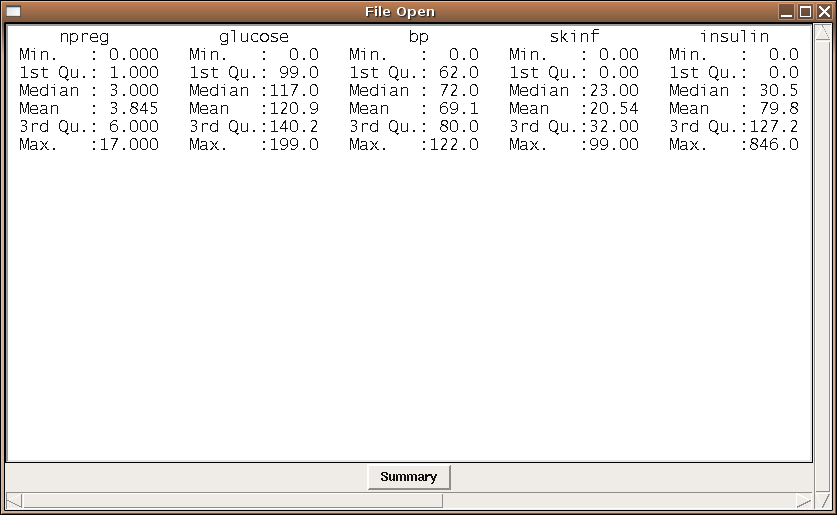
The first picture shows the file chooser (as displayed on a Linux system);
the second picture shows the diabetes data set displayed in a text window,
and the third picture shows the result of pressing the summary button.
File translated from
TEX
by
TTH,
version 3.67.
On 10 Mar 2008, 08:45.