Dynamic Graphics in R
Phil Spector
Statistical Computing Facility, UC Berkeley
1 Introduction
The tcltk package of the R programming language gives you simple access to
the Tcl/Tk toolkit originally developed by John Ousterhout. This toolkit provides a
variety of widgets, and has been ported to many computer platforms. Interfaces to the
toolkit appear in a number of programming languages including perl and
python, so learning some Tcl/Tk commands may prove useful in other settings as
well as within R.
Since R has its own plotting subsystem, there's no need to worry about
actually creating graphics through Tcl/Tk; the toolkit is only used to produce controls,
not to draw the actual graphs. There are two approaches to plotting with the
tcltk package: the first uses R's usual graphics window, with any controls
being displayed in a separate window, while the second displays your plot as an image
in a window that can contain other graphical elements.
The remainder of this paper will present some basic concepts which you may find useful when
getting started with the tcltk package. The final section contains a complete
example of a function that allows you to dynamically vary the span of the super smoother
algorithm, and to display that algorithm's default smooth.
2 Some Tk basics
The various controls that might appear as part of a dynamic graphics display are known
collectively as "widgets". Some examples of widgets are radiobuttons, scales, simple
pushbuttons, listboxes, etc. The basic widget in Tk is the frame, which is essentially
a container for any other widgets you wish to use. You can have as many frames as you want,
but each individual entity which appears on the screen must be in a "top level"
frame, created with the tktoplevel function.
When using Tk, you first create a widget (specifying its
appearance, the command to be executed when the widget is activated, etc.), and then you
specify how it should appear in its parent frame. While Tk provides a number of different
schemes for achieving this, we'll discuss the technique known as "packing". The basic
idea is to group together widgets (and accompanying labels, if appropriate) into a series of
frames, and then to call the tkpack function to put the widgets in the frames, then to
finally pack the frames into a main frame which is contained in a top-level widget.
The
tkpack function takes the parent frame as its first argument and the frame to be packed
as the second argument. By default, objects are backed into a frame from top to bottom, with
each object being centered within its parent frame.
You can control how widgets get packed into a frame by the order in
which you call tkpack, and the optional side= argument which can take the
values "left", "right", "top" or "bottom". To
align packed widgets, you can specify an anchor= argument, which can take values
representing compass directions like "n", "e", "sw", etc.
When a button is pressed or a slider is moved, you may want to call a function as a result of
the event. Such functions are know as callbacks.
To specify a callback,
you pass a function as the command= argument when first creating the widget. For
simple tasks (like a quit button), you can use an anonymous function, but one useful strategy
in preparing dynamic graphics using the tcltk package is to write a set of functions
which you want controlled by your widgets, and simply use those function names as the
command= argument. Functions created for this do not accept arguments, so you
may need to use frame 0 variables, i.e. variables set using the <<- operator
in place of <-, to keep track of information. In addition, it may be necessary to
use "..." as the argument list of your callback functions.
In addition, there are a wide range of events (key presses, mouse clicks, hitting return,
moving the
mouse in or out of a widget's space, etc.) which can be associated with commands of your
choice. The process of associating an event with an action is known as binding, and is
implemented in R through the tkbind function, providing three arguments: the widget,
the event, and the action to be performed. Events are specified as a character
variable with the event's name surrounded by angle brackets. A small sampling of events
is listed below; refer to a manual on the X window system or Tk for more information.
(In the list that follows, the letter "x" is used to represent any key on the
keyboard.)
<Return>                  <FocusIn>
<Key-x>                   <FocusOut>
<Alt-x>                   <Button1>, <Button2>, etc.
<Control-x>               <ButtonRelease1>, <ButtonRelease2>, etc.
<Destroy>                 <Double-Button1>, <Double-Button2>, etc.
                          <Triple-Button1>, <Triple-Button2>, etc.
Finally, to change properties of widgets after they are created, you can use the
tkconfig function. You call this function with the widget whose
properties you wish to change, followed by a comma-separated list of named arguments
corresponding to the properties you wish to change. In practice,
you need to follow a call to tkconfig with a call to
tcl('update') in order to actually see the changes.
3 Some Common Widgets
Note: Each of the widget functions takes, as its first argument, the parent
frame into which it will eventually be packed. In addition, most widgets accept
height= and width= arguments to specify their size, but, when using
the tkpack function, there's usually no need to provide this information.
Any arguments mentioned in the following
subsections appear after the parent frame.
3.1 Frames: tkframe
The tkframe function creates a frame, which serves as the building block of all
Tk applications. You can modify the frame's appearance through arguments such as
borderwidth, background (to specify background color), and relief
(which takes a value from among "groove",
"flat", "raised", "ridge", "solid", or
"sunken").
3.2 Labels: tklabel
The tklabel function is used to produce a simple text label. By packing a label into
a frame before packing some other widget, you can put an identifying label on a widget. In
addition to the argument
text, which specifies the text to appear in the label, you can specify font,
and size to control the appearance of the text, and, background and
foreground to control the color of the label.
3.3 Buttons: tkbutton
To create a pushbutton which, when activated, will carry out some command, use the
tkbutton function. This function accepts an argument text, specifying
the text to appear on the button, as well as command, which is a function that
will be executed when the button is pressed.
3.4 Sliders: tkscale
You can create a slider to change the value of a variable using the tkscale function.
Among its arguments are from, to and resolution, which control
the values which will be set; showvalue, which, if set to TRUE will display
the value of the variable above the slider, and orient which takes values
"horizontal" or "vertical". You specify the name of a Tcl variable
to be controlled by the slider through the argument variable, and a function to
be called each time the variable's value changes through the argument command. Note
that the variable controlled by the slider is a Tcl variable, not an R variable. This means
that you must use the tclvar function to create the variable (passing an optional
initialization value if desired), and the tclvalue
function to access its value.
3.5 Radiobuttons: tkradiobutton
To provide a set of choices where only one choice can be active at any given time, use the
tkradiobutton function. Each radio button is created and packed separately, but should
specify the same variable= argument (similar to the variable argument to
tkscale) as other radiobuttons in the same group. The value argument to
tkradiobutton provides the value that the specified variable should take when the
particular button is selected. If a command argument is specified, it will be
executed any time the button is selected; without such an argument, you would need at least
one widget somewhere in your application that specified some command to be executed.
3.6 Checkbuttons: tkcheckbutton
Checkbuttons are like radio buttons, but more than one choice among a set of buttons is
allowable. Arguments are similar to those of tkradiobutton, but
you need to specify a separate Tcl variable for each checkbutton
you produce. Since these names are character strings, they can be generated very easily
using the paste function. However, the tclvar variable mentioned previously is
a psuedo-list, and does not support subscripting. Suppose you wish to access a Tcl variable
whose name in stored in a variable called varname. (Note that the Tcl variable's name
is not varname; it's name is simply stored in that variable.) You would need to
evaluate an
expression like eval(parse(text=paste("tclvar$",varname,sep="")) in order to retrieve
the value of the variable.
3.7 Text Entry: tkentry
To allow for the entry of arbitrary text, use the tkentry function. The
width argument specifies the width of the entry field, and the textvariable
argument specifies the name of a Tcl variable to contain the entered text.
4 Example 1: Interaction Counter
This very simple example creates a frame with a label, and updates the label
each time an iteration of a loop is carried out.
require(tcltk) || stop("tcltk support is absent")
base <- tktoplevel()
tkwm.title(base,'Label Test')
frm <- tkframe(base)

lab <- tklabel(frm,text="  ",width=20)
tkpack(frm,lab)
res <- matrix(0,10,10)
for(i in 1:10){
  tkconfigure(lab,text=paste(i))
  tcl('update')
  for(j in 1:10){
      z <- rnorm(15000)
      res[i,j] <- mean(z)
    }
}
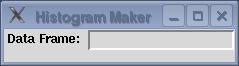
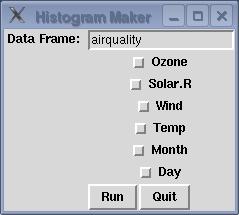
5 Example 2: Histogram Maker
This example produces a frame with a text entry field to allow entering a data frame name.
When the return key is hit inside the entry field, the frame expands to include checkbuttons
for each variable, a button to create the histograms, and another button to quit. The
appearance of the frame, both before and after hitting return inside the text entry
area, is shown in Figure 1
Figure 1: Histogram maker
  require(tcltk) || stop("tcltk support is absent")

  makebuttons <- function(...){
    df <- get(tclvalue(dataframe))
    varfr <- tkframe(infrm)
    k <- 1
    for (n in names(df)){
      assign(paste("X",k,sep=""),tclVar(""),pos=1)
      tkpack(varfr,tkcheckbutton(varfr,text=n,variable=get(paste("X",k,sep="")),anchor='w'))
      k <- k + 1
    }
    tkpack(varfr,infrm)

    bfrm <- tkframe(infrm)
    tkpack(bfrm,tkbutton(bfrm,text='Run',command=doit),side='left')
    tkpack(bfrm,tkbutton(bfrm,text='Quit',command=function()tkdestroy(base)))
    tkpack(bfrm,infrm)


  }

  doit <- function(...){
    df <- get(tclvalue(dataframe))
    use <- NULL
    for(i in 1:dim(df)[[2]]){
      thevar <- get(paste("X",i,sep=""))
      check <- tclvalue(thevar)
      if(check == '1')use <- c(use,i)
    }
    par(ask=T)
    for(i in use){
      hist(df[,i],main=names(df)[i])
    }
    par(ask=F)
  }

  base <- tktoplevel()
  tkwm.title(base,'Histogram Maker')
  frm <- tkframe(base)

  infrm <- tkframe(frm)
  tkpack(infrm,tklabel(infrm,text="Data Frame: "),side='left',anchor='n')
  dataframe <- tclVar("")
  dfentry <- tkentry(infrm,width=20,textvariable=dataframe)
  tkbind(dfentry,"<Return>",makebuttons)
  tkbind(dfentry,"<Destroy>",function()print('Hello world'))
  tkpack(infrm,dfentry)

  tkpack(frm,infrm)
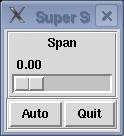
6 Example 3: Slider Control for Supersmoother
This example consists of a function which creates a slider to change the smoothing parameter sent to the R function
supersmu. In addition, a button is provided to display supersmu's
default smoothing of the data as a dotted line. Note the order in which graphing commands
are executed: by calling plot with arguments which don't vary,
we make sure that the axes
of the graph don't change. The appearance of the frame containing the slider and the
buttons is shown in Figure 2.
Figure 2: Supersmoother Control
supsmufn <- function(x,y){

  library(modreg)
  require(tcltk) || stop("tcltk support is absent")
  supsmufn.auto <<- 0

  chngplt <- function(...){
    span <- as.numeric(tclvalue(span))
    if(span == 0)span <- 1e-6
    smth <- supsmu(x,y,span=span)
    plot(x,y)
    lines(smth$x,smth$y)
    if(supsmufn.auto == 1)dobaseplot()

  }

  baseplot <- function(...){
    if(supsmufn.auto == 0)supsmufn.auto <<- 1
    else supsmufn.auto <<- 0

    if(supsmufn.auto)dobaseplot(x,y)
  }

  dobaseplot <- function(...){
    smth <- supsmu(x,y)
    lines(smth$x,smth$y,lty=2)
  }

  base <- tktoplevel()
  tkwm.title(base,"Super Smoother")

  mainfrm <- tkframe(base,borderwidth=2)

  slide <- tkframe(mainfrm,relief="groove",borderwidth=2)
  tkpack(tklabel(slide,text="Span"))

  span <- tclVar(0)
  tkpack(tkscale(slide,command=chngplt,from=0,to=1.0,showvalue=T,
                 variable=span,resolution=.01,orient="horiz"))
  tkpack(mainfrm,slide)


  butfrm <- tkframe(mainfrm,borderwidth=2,relief="groove")
  a.but <- tkbutton(butfrm,command=baseplot,text="Auto")
  q.but <- tkbutton(butfrm,text="Quit",command=function()tkdestroy(base))
  tkpack(butfrm,a.but,side="left")
  tkpack(butfrm,q.but,side="right")
  tkpack(mainfrm,butfrm)
}
7 Using tkrplot for plotting
As mentioned in the introduction, a second method for plotting allows placing
controls in the same window as the plot itself. The tkrplot
package provides the necessary functions to create an image representing your
plot, and to automatically redraw it when necessary.
To use the tkrplot library, a tkrplot widget is created using
the tkrplot function: this function accepts two arguments: the frame
in which the plot is to be displayed, and the name of a function (with
... as its only argument) which will do the actual plotting.
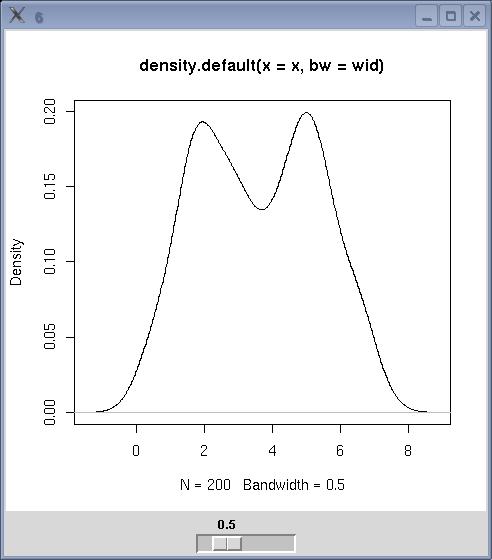
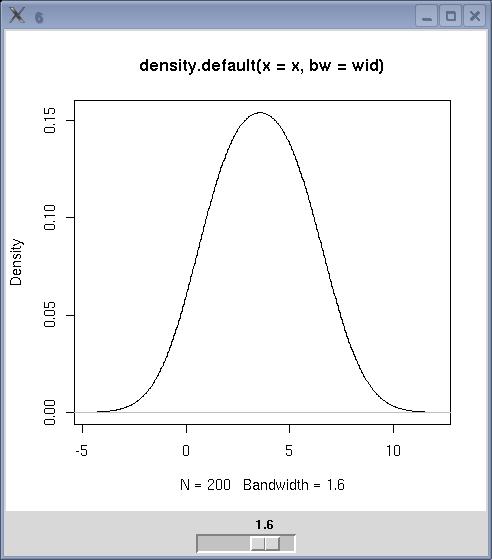
To illustrate, consider a GUI consisting of a plotting window displaying the
smoothed density of a vector of data, with a slider directly below the plot
window to control the smoothing bandwidth. First, we create a toplevel
window, a variable to
hold the width, and write a function that will create the appropriate display:
tt = tktoplevel()
width = tclVar(.5)
plotdens = function(...){
   wid = as.numeric(tclvalue(width))
   plot(density(x,bw=wid))
}
Next, we create the tkrplot widget using
this function,
and create a trivial updating function that simply calls tkrreplot:
img = tkrplot(tt,plotdens)
densplot = function(...)tkrreplot(img)
Finally we create a slider to call the updating function when its
value is changed, and pack all the widgets:
scl = tkscale(tt,command=densplot,from=0.1,to=2,showvalue=TRUE,
              variable=width,resolution=0.1,orient='horiz')
tkpack(img,side='top')
tkpack(scl,side='top')
The GUI is illustrated below using a mixture of normal distributions, and
two different bandwidths.
Figure 3: Density Smoother
File translated from
TEX
by
TTH,
version 3.67.
On 5 Mar 2008, 09:04.