Write and test a function for the Cholesky decomposition of a symmetric positive definite matrix. Test it on an arbitrary symmetric positive definite matrix, and verify that it works through multiplication or using R or matlab.
In a one-way ANOVA, we test the null hypothesis that the means of several
different groups are all equal to each other. Let ![]() represent
the
represent
the ![]() th observation in the
th observation in the ![]() th group, with
th group, with ![]() and
and
![]() . Then a suitable test statistic for the
null hypothesis is:
. Then a suitable test statistic for the
null hypothesis is:
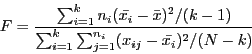
where
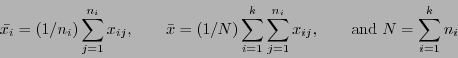
Under the null hypothesis of the means being equal for all k groups, the
statistic ![]() follows the F-distribution with
follows the F-distribution with ![]() and
and ![]() degrees of
freedom.
degrees of
freedom.
- Generate 5 groups of data, each with 6 uncorrelated observations from
a normal distribution with mean 0 and variance 1. (This means that in
the formulas above,
 , and
, and  for
for  .)
Use your programs from assignment 2 to
generate the random numbers. Test to see if the F-statistic described
above follows an F-distribution by comparing the upper 90th, 95th and 99th
percentiles of your observed F-statistics with their theoretical values
found either in tables or from the appropriate dcdflib routine.
(You'll need
to sort your data to find the percentiles; either use routines from
a subroutine library such as the GNU Scientific Library (libgsl),
or
``borrow'' the function in sort.c from the s243 class
account - i.e. - s243/samples/sort.c)
.)
Use your programs from assignment 2 to
generate the random numbers. Test to see if the F-statistic described
above follows an F-distribution by comparing the upper 90th, 95th and 99th
percentiles of your observed F-statistics with their theoretical values
found either in tables or from the appropriate dcdflib routine.
(You'll need
to sort your data to find the percentiles; either use routines from
a subroutine library such as the GNU Scientific Library (libgsl),
or
``borrow'' the function in sort.c from the s243 class
account - i.e. - s243/samples/sort.c)
- Repeat part a), but instead of using 6 uncorrelated observations in each
of the 5 groups, generate 6 correlated variables with
corr(
 ,
,  ) =
) =  . What does this tell you
about the
behavior of the F-statistic in a one-way ANOVA when the data is
correlated?
. What does this tell you
about the
behavior of the F-statistic in a one-way ANOVA when the data is
correlated?
Write and test a function for the Gram-Schmidt
orthogonalization of
an arbitrary ![]() matrix. Test it on a matrix of your choice, and
verify that it works either through multiplication or using R or matlab.
matrix. Test it on a matrix of your choice, and
verify that it works either through multiplication or using R or matlab.
Write a program which takes as input a matrix of ![]() and
and ![]() values and
then performs a regression using the function for Gram-Schmidt
orthogonalization that you wrote in part 3. The output of the program
should include the parameter estimates, the standard errors of the
parameters,
the estimated value
of
values and
then performs a regression using the function for Gram-Schmidt
orthogonalization that you wrote in part 3. The output of the program
should include the parameter estimates, the standard errors of the
parameters,
the estimated value
of ![]() and the residual value
for each observation.
and the residual value
for each observation.
Hints: Let ![]() be
be ![]() and
and ![]() be
be ![]() . If you use the
augmented matrix
. If you use the
augmented matrix ![]() instead of just
instead of just ![]() , and orthogonalize
only the first p columns, then the last column of the orthogonalized
matrix will be the residuals. To get the standard errors of the
parameter estimates, you may need to invert an upper triangular
matrix. You can use the following algorithm. Let T be a
, and orthogonalize
only the first p columns, then the last column of the orthogonalized
matrix will be the residuals. To get the standard errors of the
parameter estimates, you may need to invert an upper triangular
matrix. You can use the following algorithm. Let T be a ![]() upper triangular matrix, and let U be it's inverse.
upper triangular matrix, and let U be it's inverse.
forto
by


forto
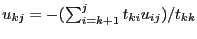
end
end