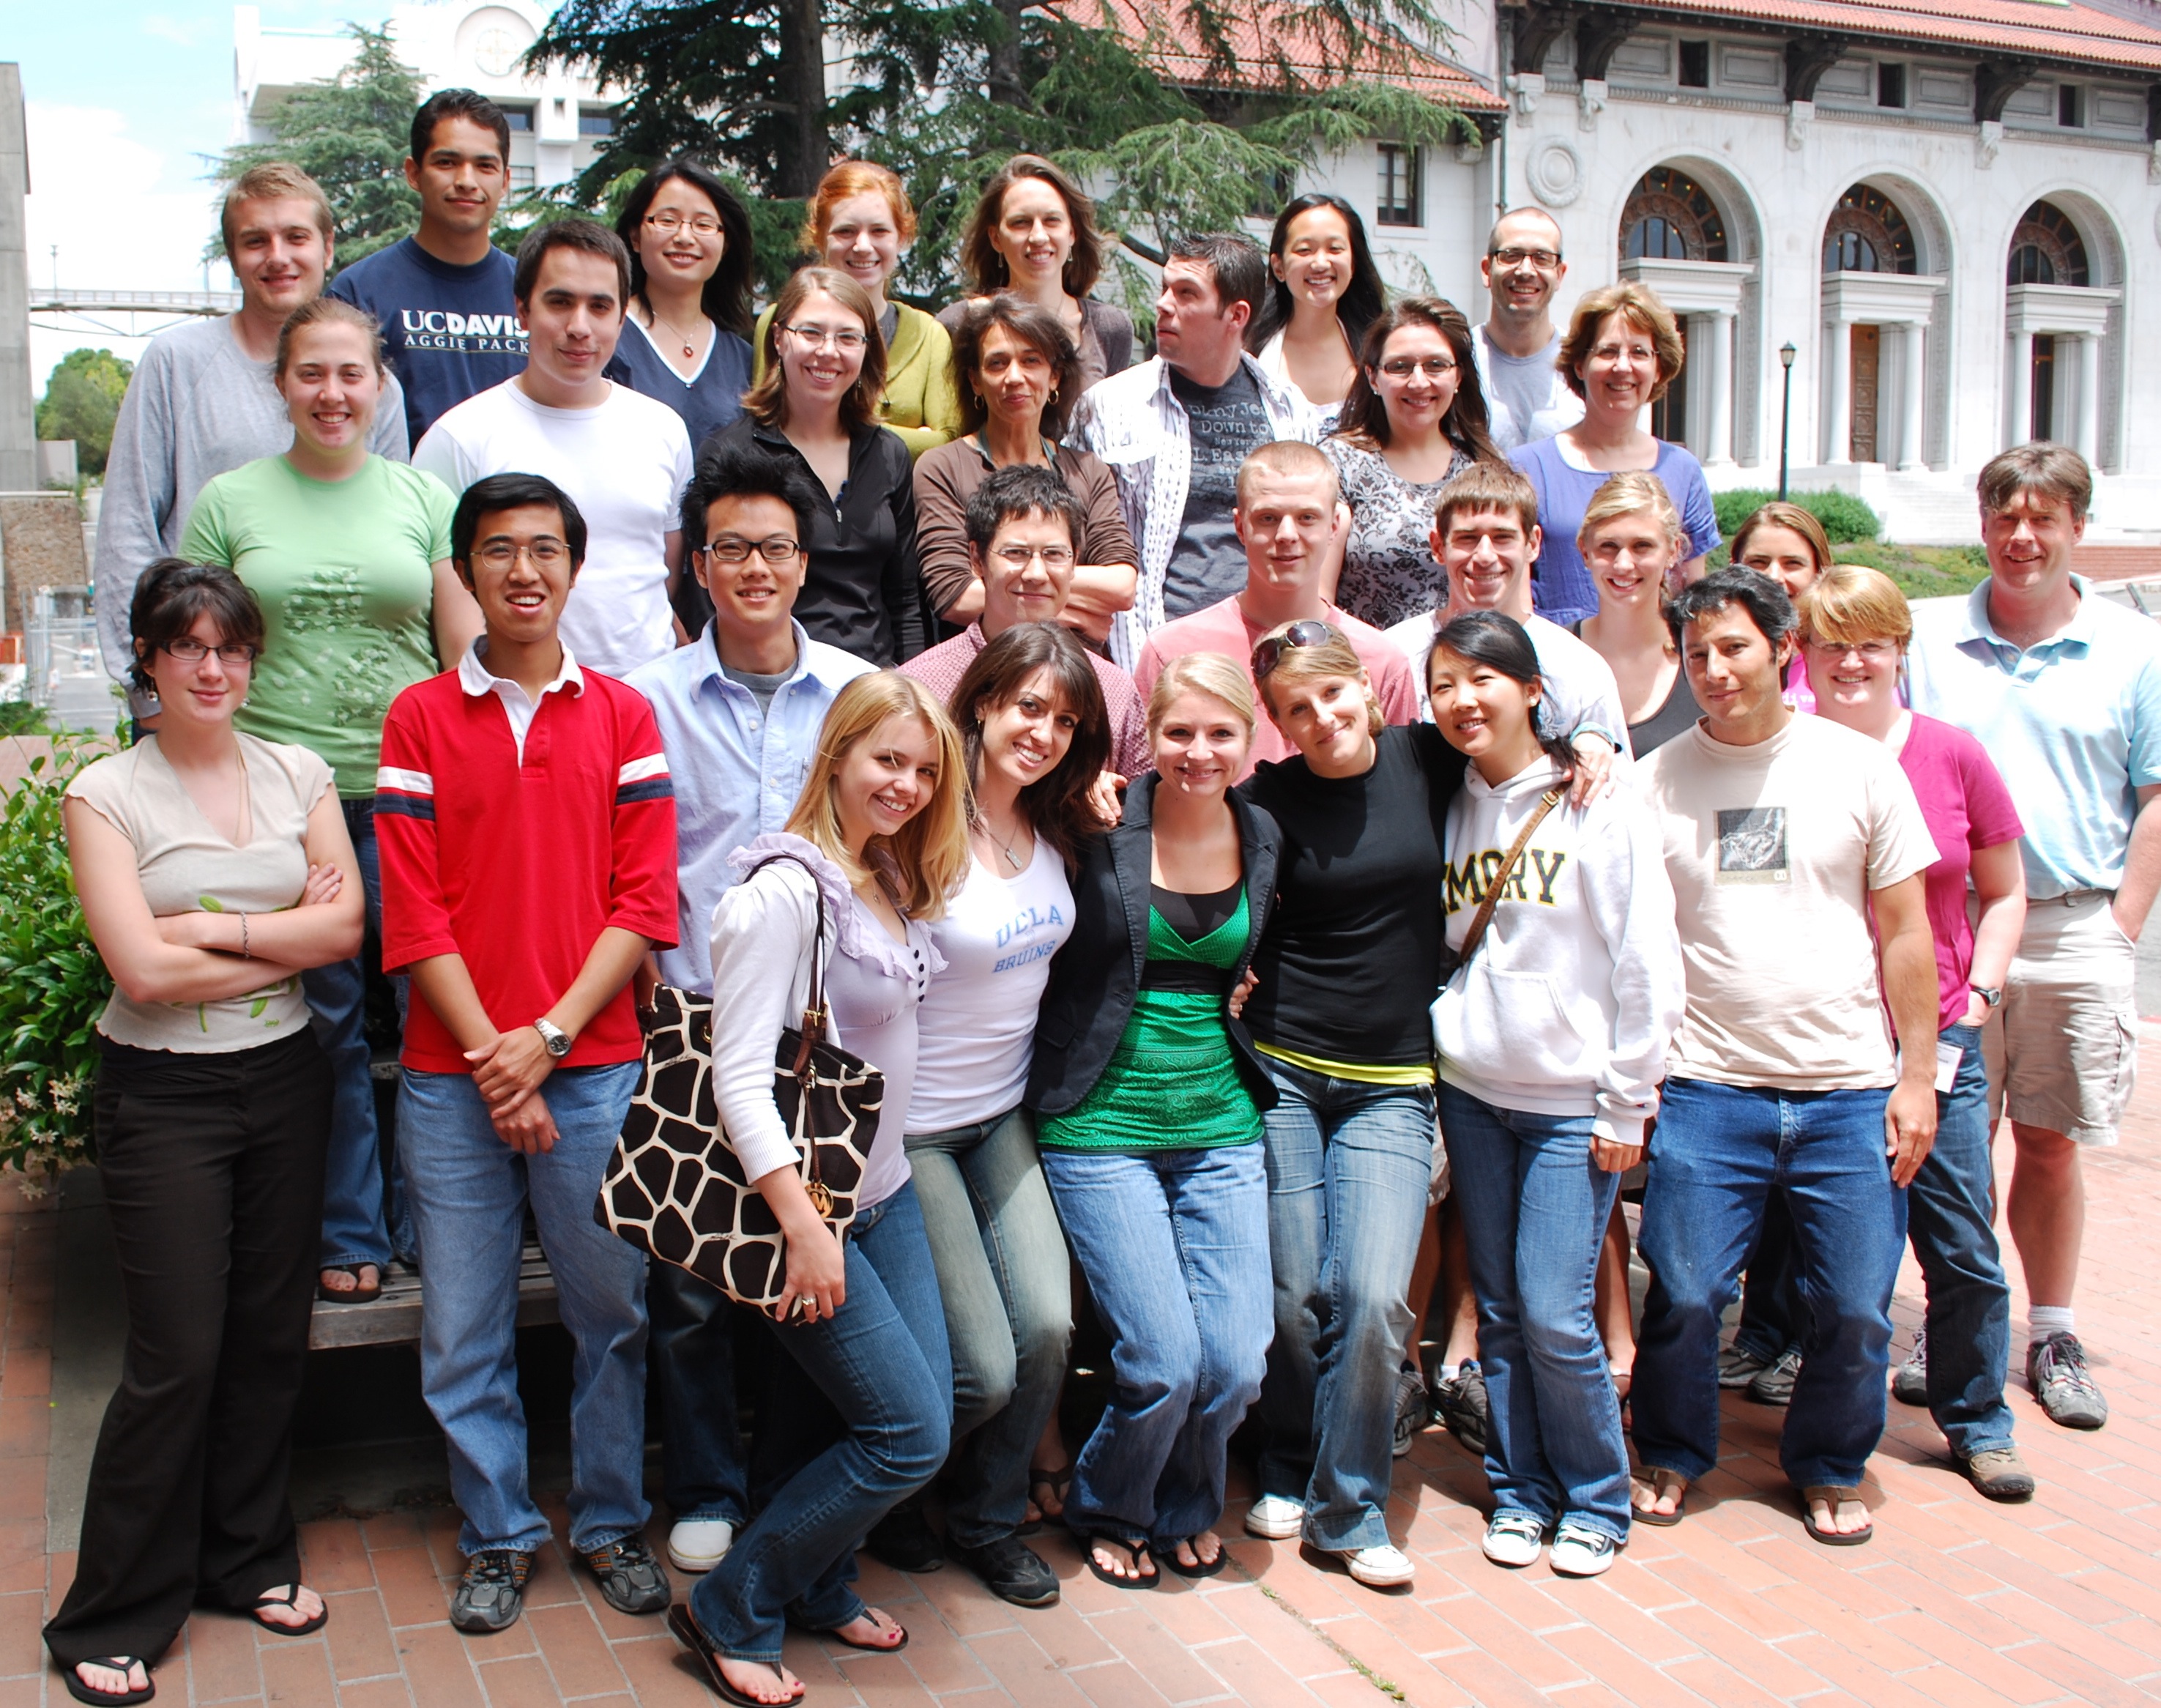
Overview
The ESR Workshop is designed to introduce undergraduates to the exciting work being done in statistics, the science of data. The Workshop exposes students to how statisticians work on important and interesting scientific problems.
The first full day, Sunday, was dedicated to an introduction to R. We also explored the CDC's Behavioral Risk Factor Surveillance System (BRFSS) data and delays in all of the US domestic airline flights in 2008 made available by the Burea of Transportation Statistics while learning about some basic visualization tools in R.
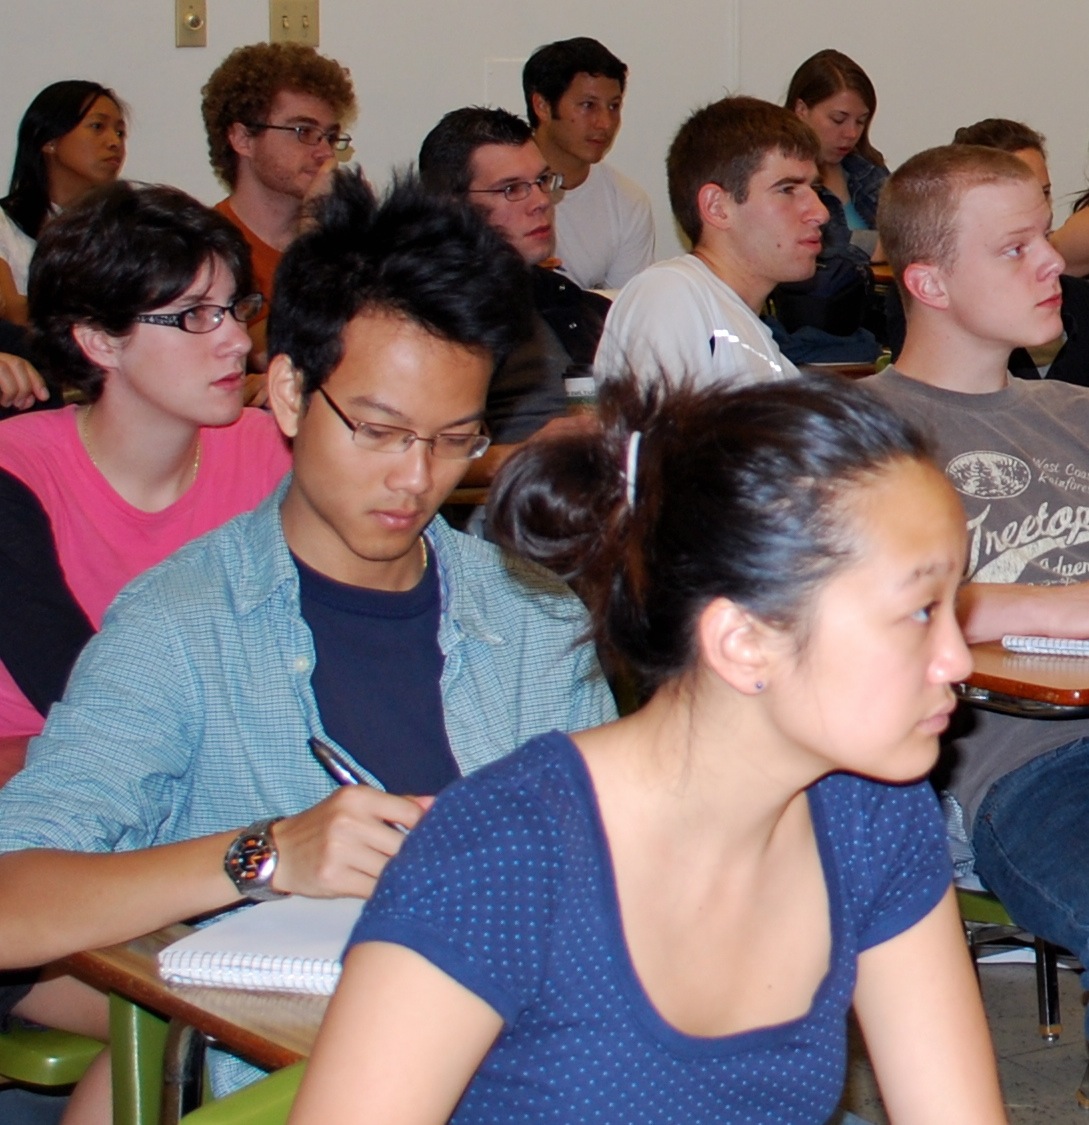
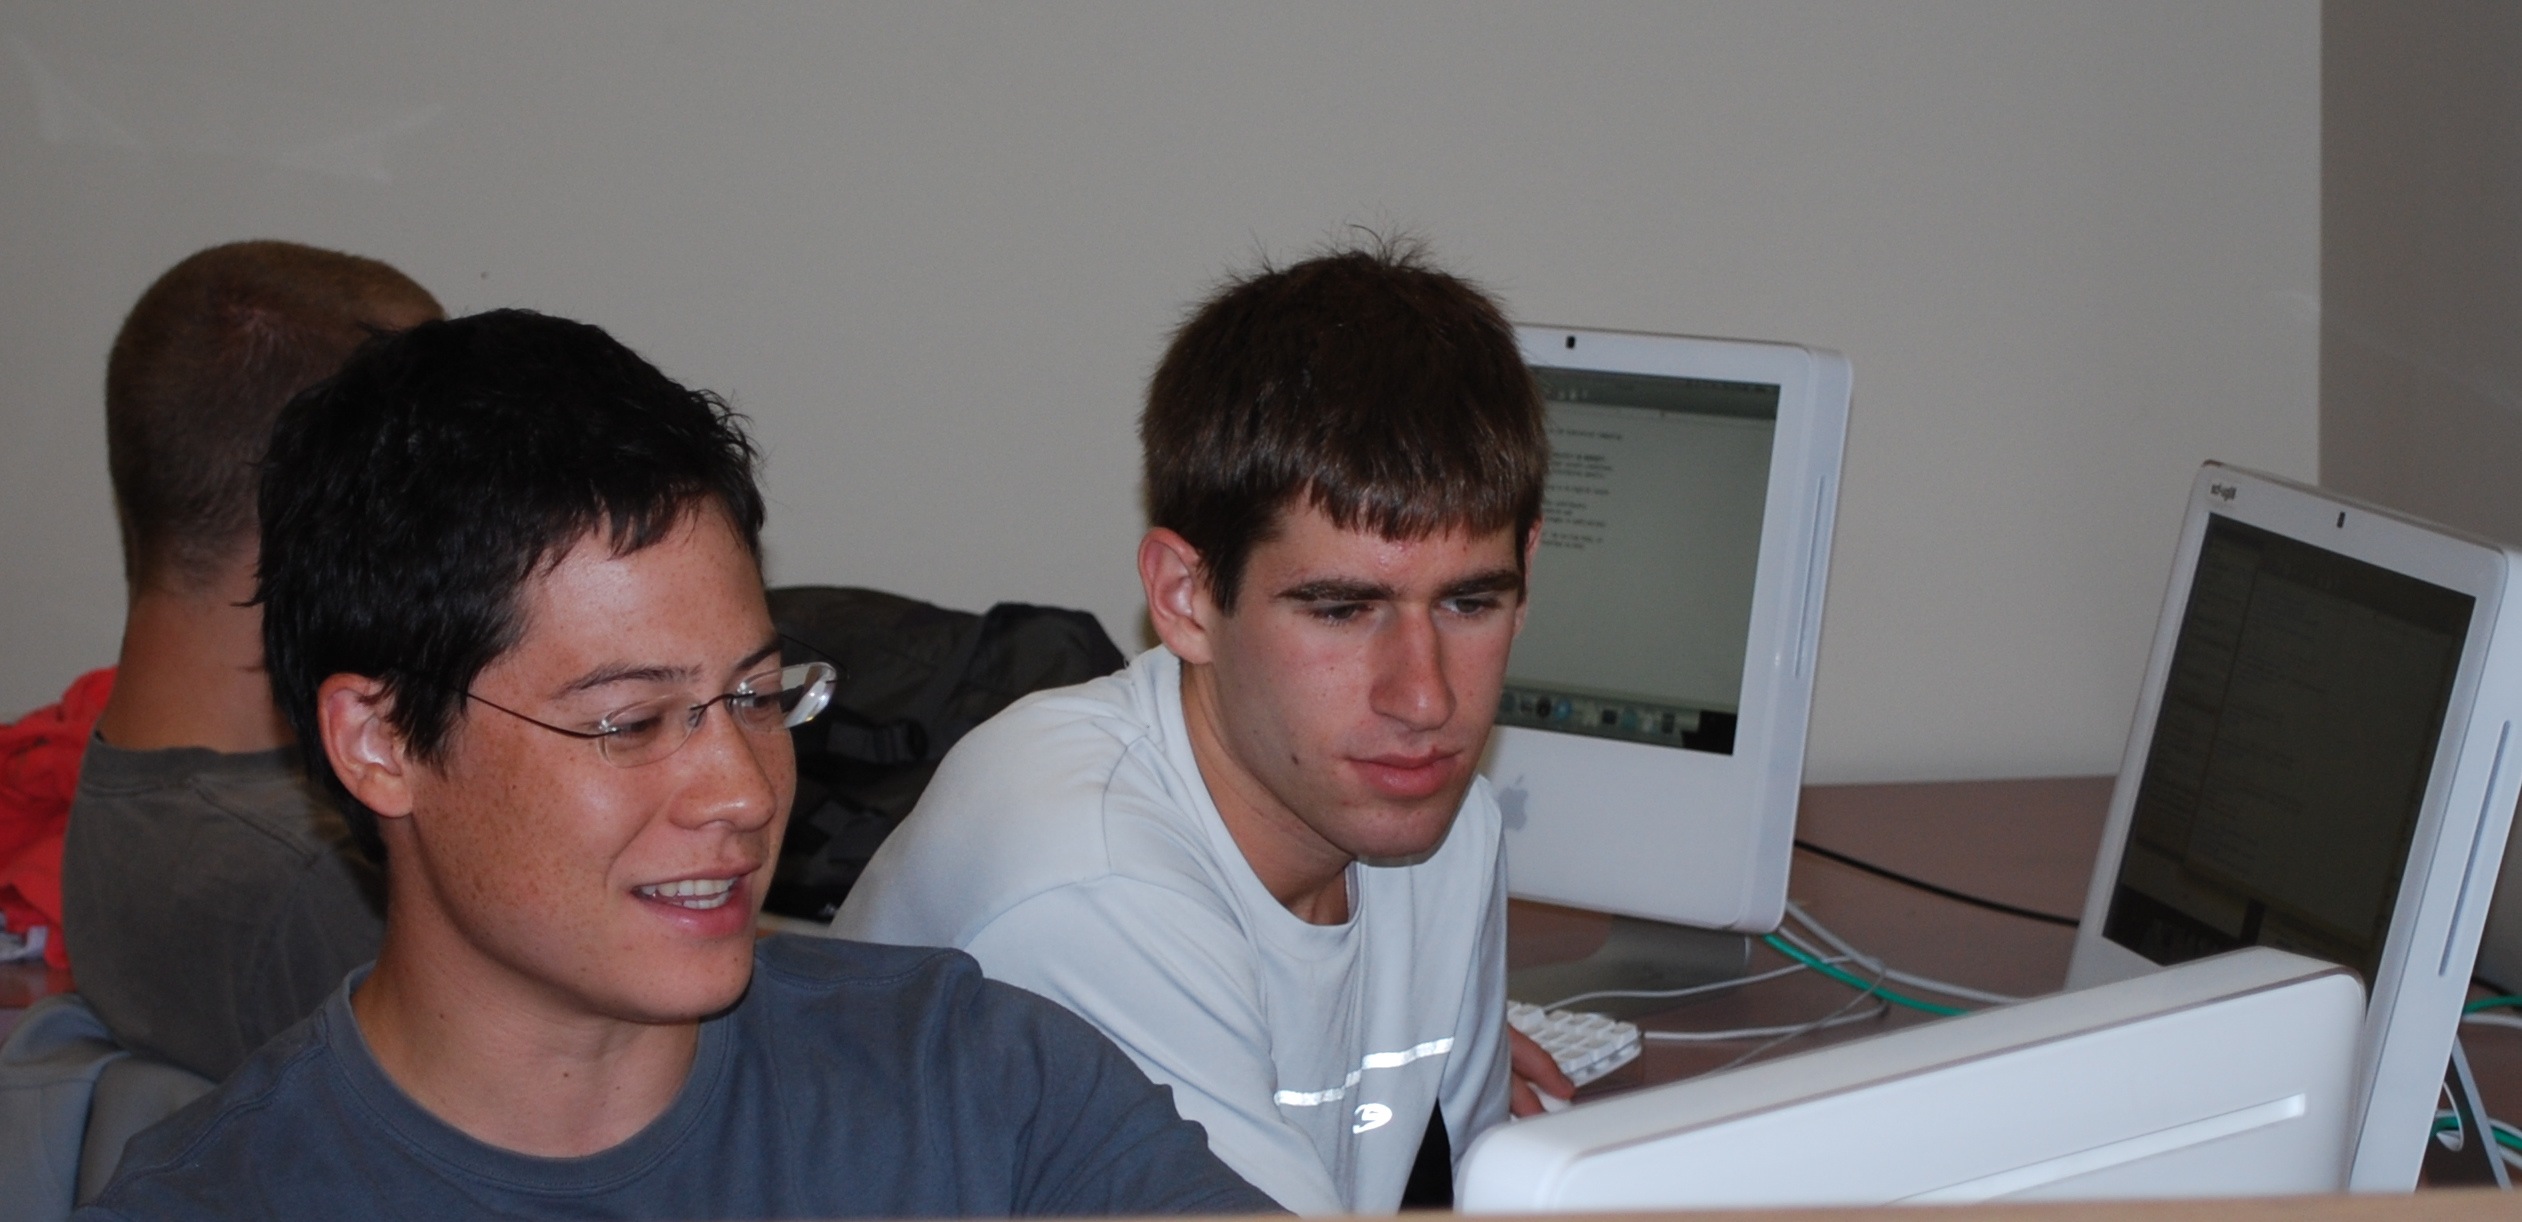
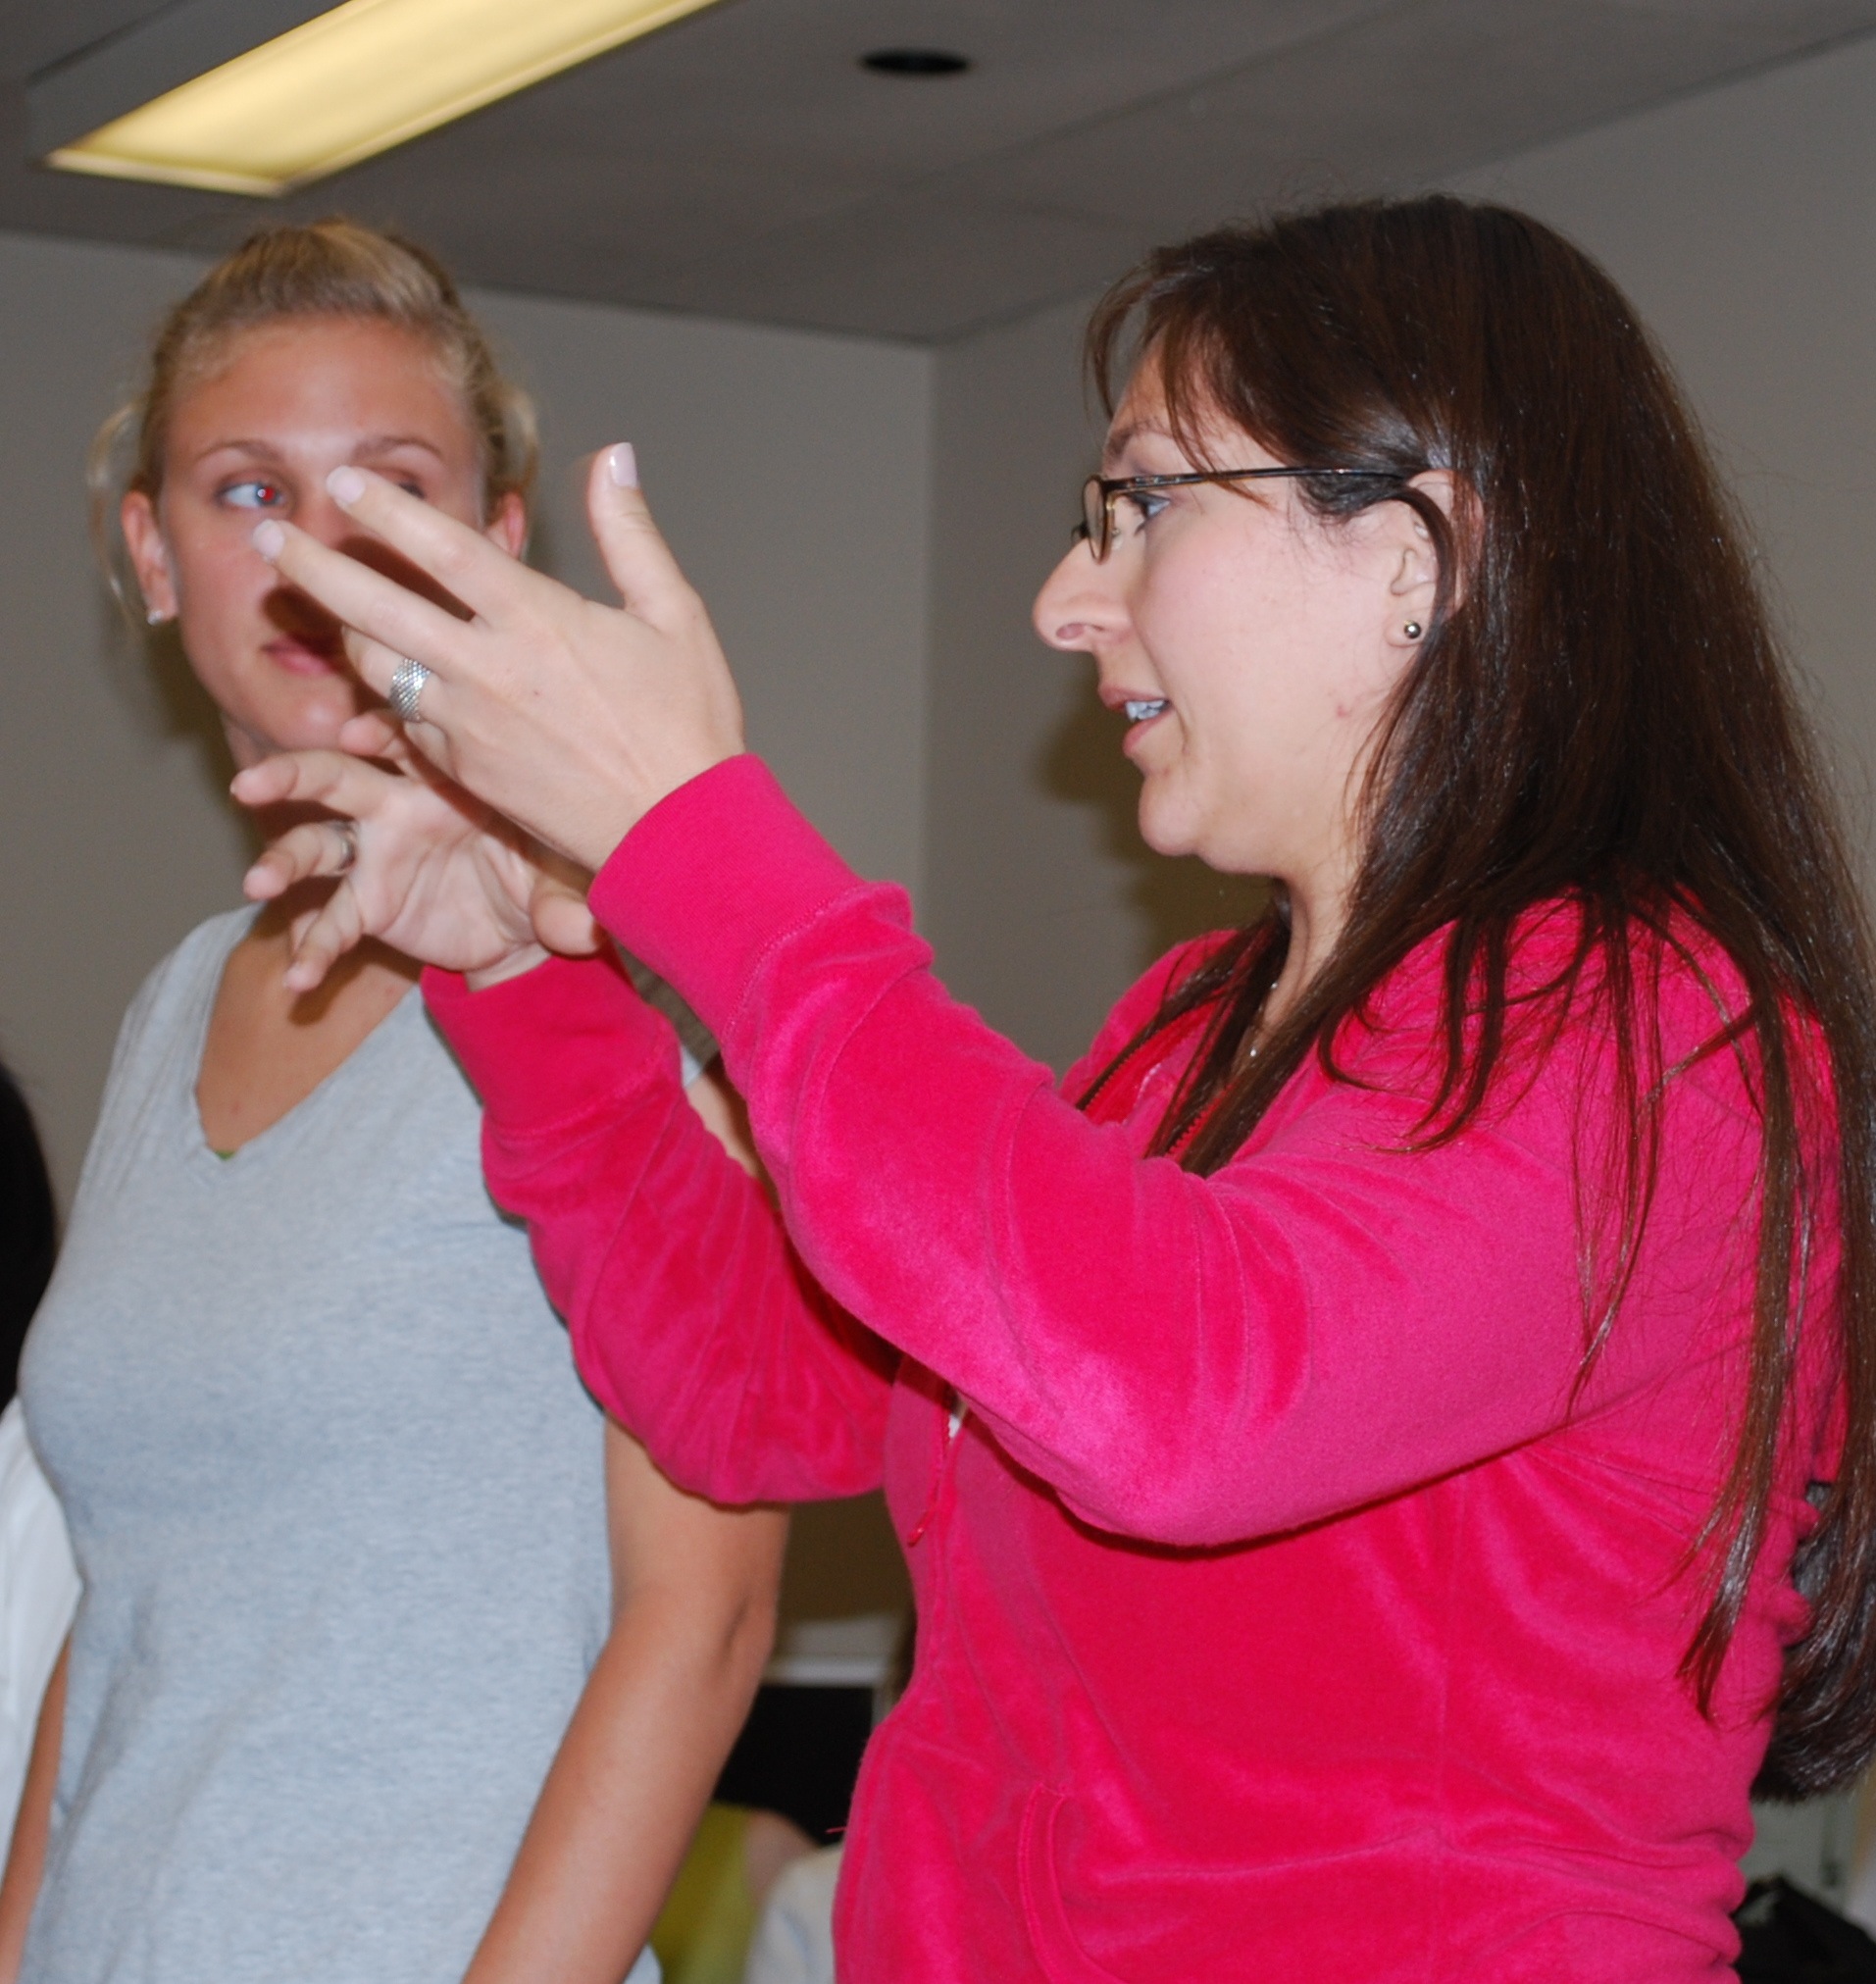
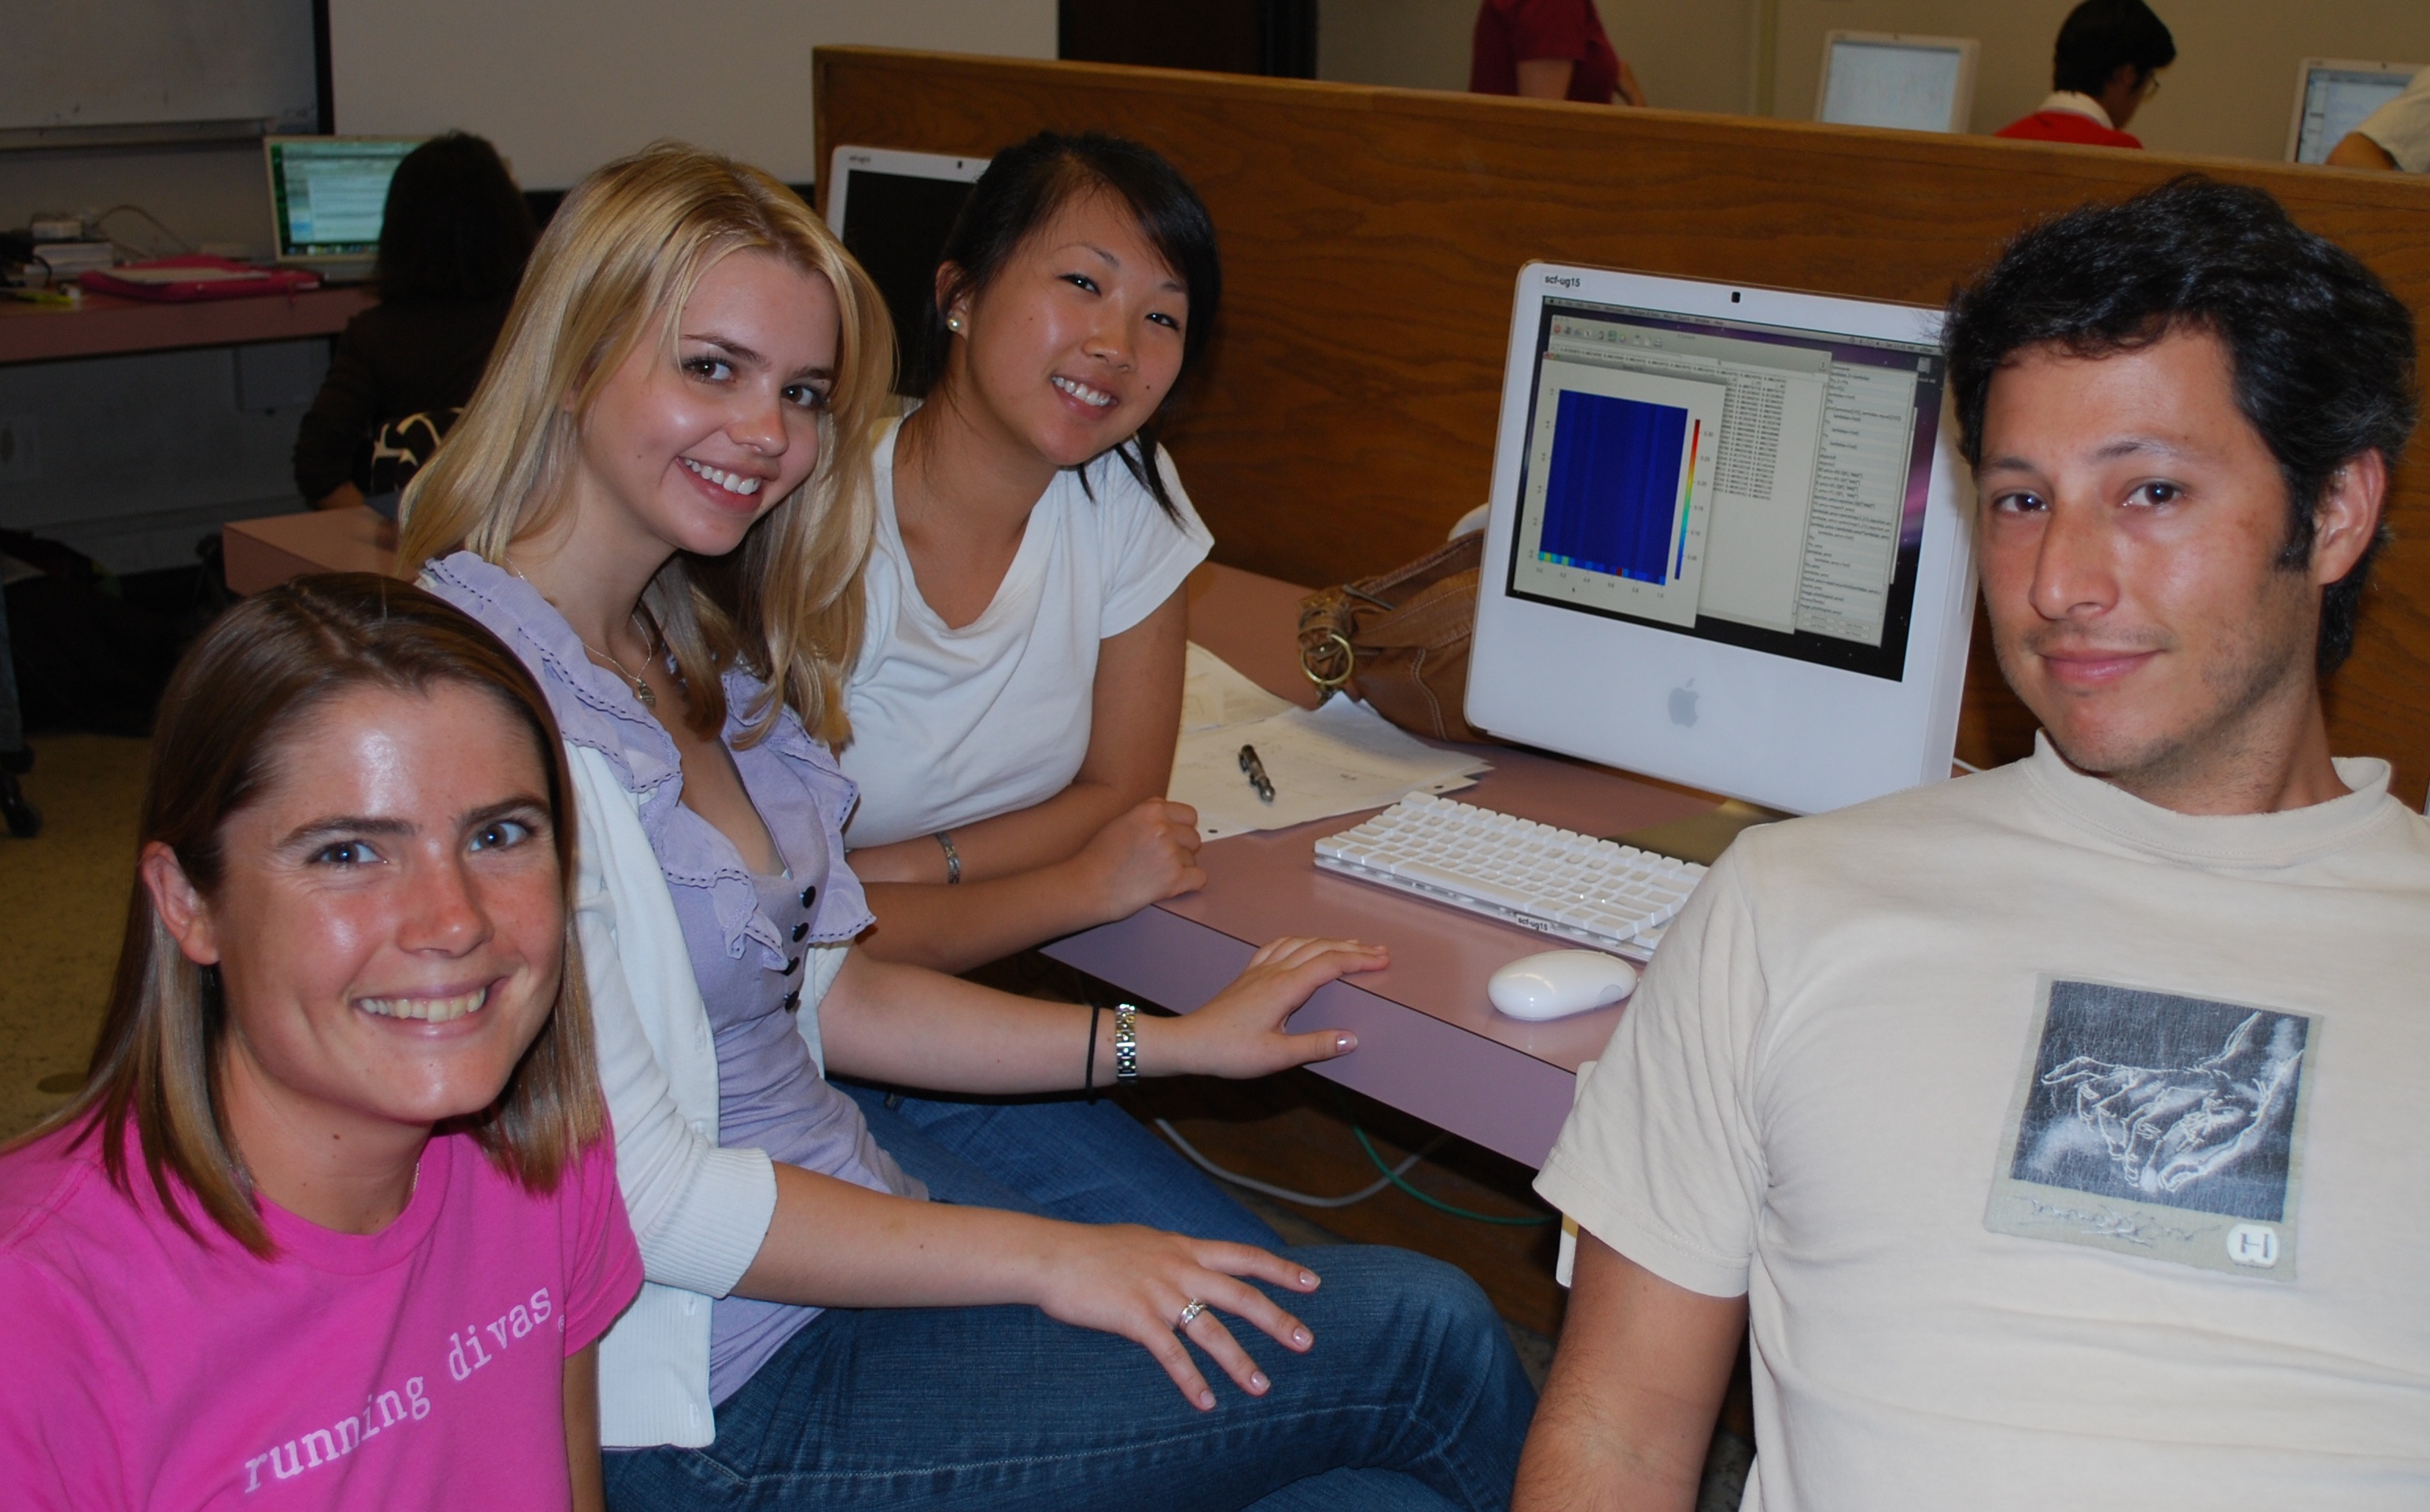
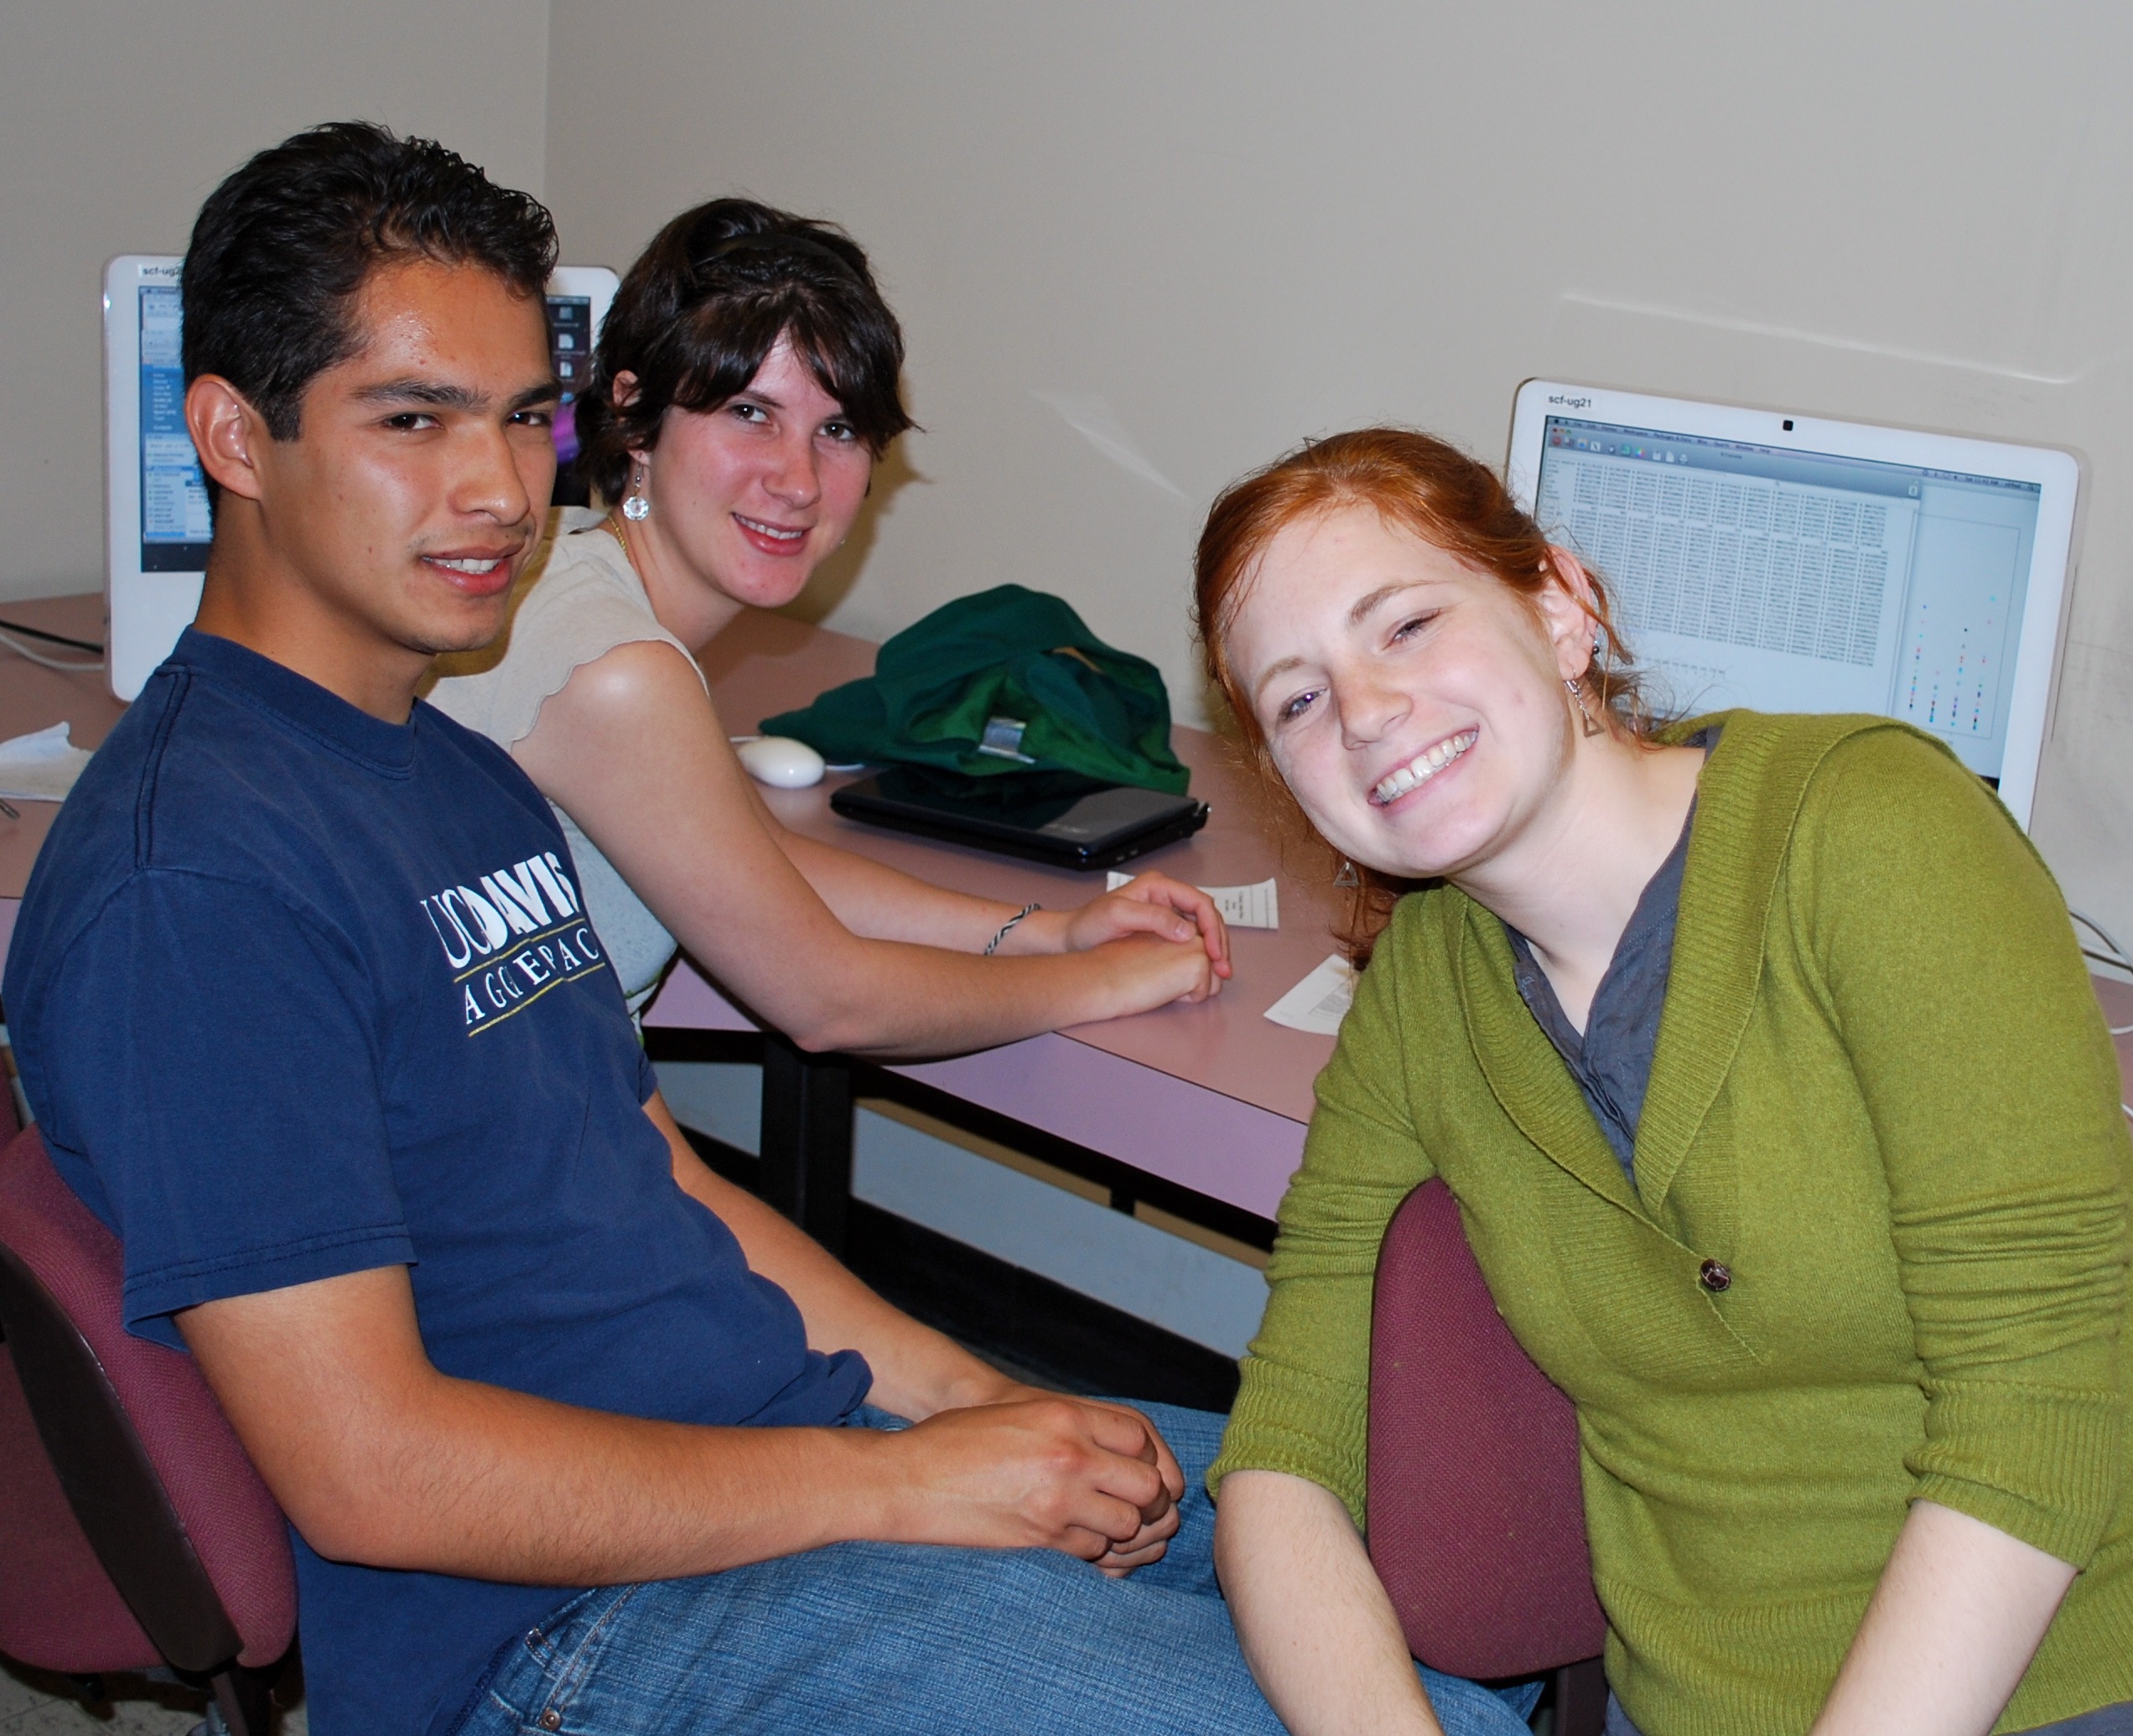
Over the next 6 days, we worked intensively for two days on each of three topics, guided by the expert statistician who did the research. The students worked in groups of 3 exploring different questions, using statistical techniques described in short "tutorials" by the researcher/speaker. The speaker, organizers, and graduate students assisted the groups of students as they explored the data, discussing, suggesting and clarifying ideas and helping with computational tasks in R. Students regularly reported to the whole group, presenting a relevant graphic and discussing with the researcher the implications of their findings.
Butterfly Ballots and other Election Irregularities
Jas Sekhon (UC Berkeley) introduced data regarding anomalies in the US presidential election of 2000. We explored the effects of the butterfly ballot in Palm Beach County in Florida and estimated how many votes were cast for Buchanan that we might expect to have been intended for Gore.
We then went on to fit a weighted logistic regression model and estimated the proportion of votes using the Republican proportion and the census information. We also compared the results from the absentee ballots which did not use the butterfly ballot.
Finally we used shaded maps to show the abrupt change across county boundaries, illustrating the effect of the butterfly ballot.
Recommending Television Programs
The next topic was building a recommendation system for television viewers. Chris Volinsky from AT&T gave us detailed data on the television viewing "activities" of 1000 households, including what programs the viewers were watching, when they changed channels, and so on. Different groups of students explored one of 4 different time periods, each covering a large event such as the Oscars and the Superbowl. We discovered these big events, and explored what programs were popular and what times of the day different households tended to watch television. The goal was to move towards finding similar types of programs and similar types of viewers.
We ended with text mining. The goal was to be able to recommend new shows that nobody had yet watched. To do this, we tried to find similar shows based on their short blurb/description. We used term frequency and inverse document frequency to create variables that we then used to compute distances between programs.
Combining Global Climate Models
Claudia Tebaldi (UBC) led the students in exploring global climate change. We looked at 21 international climate models that are used to simulate and study future climate characteristics under different scenarios. Over the 2 days, we examined different ways to combine these models to get better estimates.
We started by looking at temperature and precipitation for the last 60 years and seeing how these have changed generally and in different parts of the world and in different times of the year, i.e. seasons. Next we looked at the predictions from the 21 different models and compared how they matched the "observed" weather over these six decades.
We moved on to an approach to estimate reasonable weights for combining the models. These weights were based on both how well the models predicted the observed climate variable(s) and how much they agreed with the other models. This involves providing an initial starting point and iterating to estimate the weights until they converge. We estimated the weights separately for each of 22 regions around the world. We then explored the results to see which models were important and whether there were clear "winners".
The weights we worked with above were somewhat ad hoc. Claudia used a different approach via a hierarachical Bayesian model which connect the weights as inverses of the variances of a Normal distribution. We used Markov Chain Monte Carlo to estimate the parameters of the model and then looked at these to see how temperature is likely to change by comparing the densities in different regions. We ended up with an informative map.
Other Activities
Dr. Colette Patt from the Dean's office at Berkeley led a 1 1/2 hour discussion about thinking of and applying to graduate school. She gave a marvellous overview ranging from thinking about why one might go to graduate school to very practical and important details about applying to and accepting a particular school. She conveyed a wealth of information to the students, and there were lots of questions and discussions, with comments from the professors providing additional perspectives specifically about graduate programs in statistics.
On Friday evening, we held our Workshop banquet at the Great China restaurant.