Presidential Election - 2000
This is based on a 2 day presentation by Jasjeet Sekhon (UC Berkeley) at
our undergraduate Summer School this year ('09) and his papers.
This case study is about exploring anomalies in the 2000 Presidential
Election in which George W. Bush won the election but lost the popular
vote. Importantly, he won the state of Florida and all its
electoral votes in spite of claims of certain "issues" and
irregularities that arose and the margin of 537 overall votes! The
study explores different anomalies and attempts to see if they really
are anomalies and to quantify the effect of one particular anomaly.
Complaints arose on election day about the layout of Palm Beach
County's (PBC) ballot. Specifically, a "butterfly" ballot
which looks like
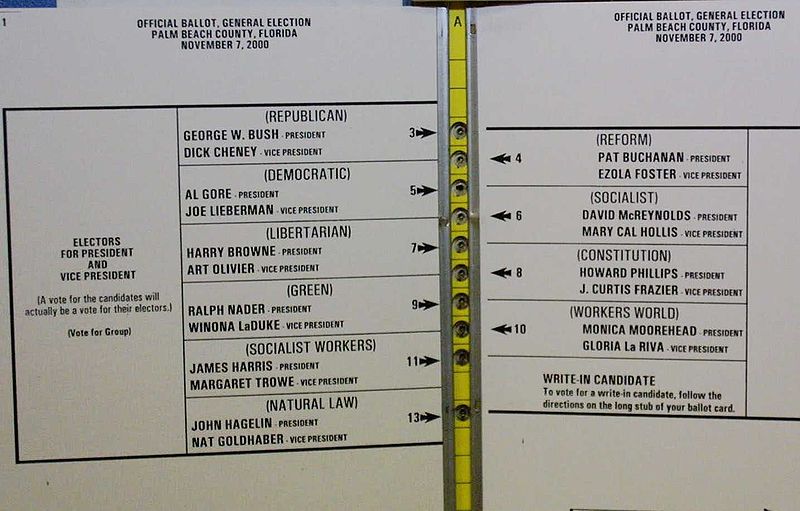 caused problems.
By law, the order of the parties corresponds to the
order of the election in the previous election (state-wide).
By this prescription, Gore should have been second, but
because of the two page layout, Buchanan was second.
"Many" claimed to have voted erroneously.
This ballot was unique to Palm Beach county.
caused problems.
By law, the order of the parties corresponds to the
order of the election in the previous election (state-wide).
By this prescription, Gore should have been second, but
because of the two page layout, Buchanan was second.
"Many" claimed to have voted erroneously.
This ballot was unique to Palm Beach county.
This project involves trying to determine if, and provide evidence for,
the problem is real and then quantify what the likely effect was
on the number of votes Buchanan received.
The student is supposed to think about how to go about finding an effect
and evidence to support their conclusion.
Much of the investigation is complicated by the very different
numbers of votes in the different states, counties and precincts.
We have to take this into account. We use EDA to look for the effect
and compare the results from PBC with the rest of Florida and the rest
of the country. We identify other outliers and try to understand these.
We use regression to develop a model for the proportion of votes for
Buchanan using votes for republicans, census data and previous
election data. This is a GLM and involves over-dispersion and
also issues of robustness due to the different counts and proportions.
We also use maps and precinct level data to compare what should be
similar voting patterns. And we use the comparison between absentee
and election day voters and also party affiliation within ballots
to further conclude that there was an effect.
Details
The specific questions are:
- did this affect the voting in Palm Beach?
- how can "prove" this?
- can we quantify how many votes went to Buchanan erroneously
that should have gone to Gore?
- what is the standard error on this?
- are there other data sources that confirm/consolidate our conclusions?
What can we explore?
We have voting data from the entire nation at the state and county
level that gives vote count and percentage for each candidate
including the different minority candidates.
Can we detect the anomaly from this?
When we look at "obvious" plots of gore versus bush, gore versus
buchanan, bush versus buchanan the "outliers" are not evident. We
immediately have issues with counties and states of different sizes
and comparing total counts and also comparing percentages.
We have to take account of different variances based
on different electorate size and different proportions.
This introduces the students to variation in different ways.
We also have election data from the previous elections,
i.e. 1994 and 1996. We contrast these with the 2000 results.
We also have census data that gives county- and state-level data
on education levels, income levels, ethnicity, ... We can try to
compare Palm Beach County to other counties in the country. We do this
via visual displays.
Next we develop regression models for predicting
the county-level Buchanan vote based on the votes for Bush and
previous election results and
demographic variables.
We do this for each state, aggregating states with
few counties, e.g. Hawaii, Rhode Island, Washington DC.
The regression models need to take account of the different
proportions and county sizes.
An overdispersed
We also have precinct level data for Florida. We draw a map of the
Buchanan vote percentage by precinct and contrast Palm Beach County
with neighboring counties.
We also look at other variables such as income, education &
ethnicity
to illustrate that some neighboring counties are very similar
in some characteristics but different in others and
that the voting patterns tend to flip.
The absentee ballot used for Palm Beach County was not a butterfly
ballot but rather a regular, sequential ballot. We compare the results
from this sub-group to see if there is a "ballot effect". Can we
determine if the absentee voters are substantively different in other
characteristics?
We clearly don't have information about how an individual
voted. We do however have individual ballots and can look at how an
individual voted for different candidates and parties for different
positions, e.g. president, senate, congress, local.
Because we used this in our summer school, the data are available
directly as R objects via an R package and so the students have
to do no data input. However, we can have them
collect this information from various sources.
Duncan Temple Lang
<duncan@wald.ucdavis.edu>
Last modified: Wed Jul 22 13:58:51 PDT 2009
 caused problems.
By law, the order of the parties corresponds to the
order of the election in the previous election (state-wide).
By this prescription, Gore should have been second, but
because of the two page layout, Buchanan was second.
"Many" claimed to have voted erroneously.
This ballot was unique to Palm Beach county.
caused problems.
By law, the order of the parties corresponds to the
order of the election in the previous election (state-wide).
By this prescription, Gore should have been second, but
because of the two page layout, Buchanan was second.
"Many" claimed to have voted erroneously.
This ballot was unique to Palm Beach county.