Stat 133 Midterm Exam Spring 2011
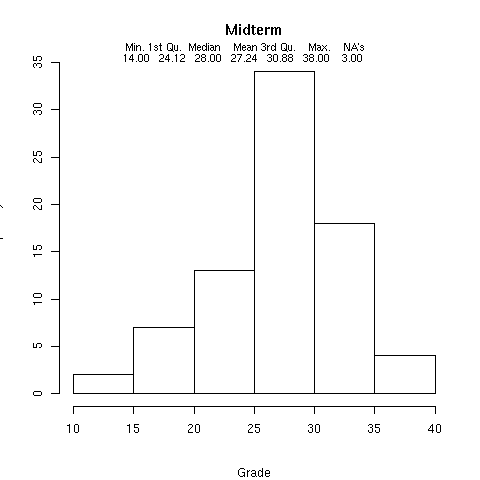
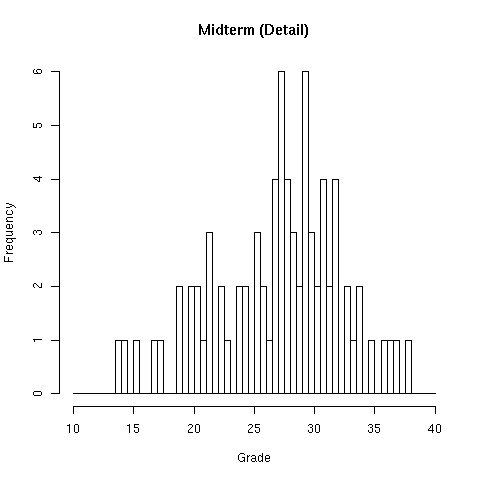
1 Grade Distribution
The two graphs shown below illustrate the grade distribution for the
midterm:
2 Answers and Grading
A copy of the midterm (pdf) with the answers can be found here. The following notes show how I subtracted points for incorrect
answers:
1 a)  missing which                    -1
      which(x,na.rm=TRUE)             -.5
      x[is.na(x)] not sum(is.na(x))   -.5
  b)  summing x, not !is.na(x)         -1
      dim instead of length           -.5
      is.na instead of !is.na         -.5
  c)  assign wrong thing               -1
      using sub instead of =           -1
  d)  forget return value              -1

2 a)  no ~                            -.5
  b)  use sort instead of order        -1
      no indexing                      -1
      missing ,                       -.5
      which used incorrectly           -1
  c)  max instead of which.max         -1

3 a)  using strsplit instead of nchar  -1
  b)  forgetting sapply                -1
      average or avg instead of mean  -.5
  c)  using strsplit instead of nchar  -1
      using which incorrectly          -1
      not indexing book                -.5

4 a)  wrong first argument             -.5
      wrong second argument            -.5
      missing na.rm=TRUE               -.5
  b)  which instead of sum             -1
      sum of data instead of condition -1
      wrong logical condition          -1
      length instead of nrow           -.5
  d)  not using table                  -1

5 a)  not switching the order          -1
      not using sub or gsub            -1
  b)  grep instead of sub              -1
  c)  not using gregexpr               -1.5
      wrong pattern                    -1
      not using unlist                 -.5
  d)  using gsub without ^             -.5
File translated from
TEX
by
TTH,
version 3.67.
On 4 Mar 2011, 11:14.