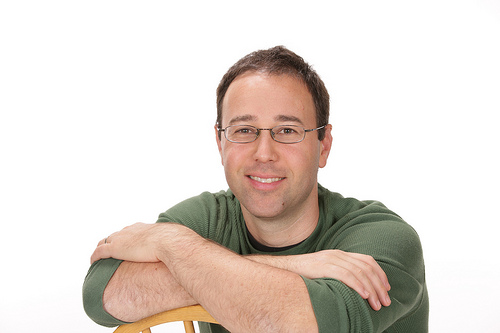
Tsachy Weissman
Information Systems Laboratory, Department of Electrical Engineering, Stanford University.
We'll start with a brief tour through some of the information theory literature - both classical and recent - on relations between information and estimation under Gaussian noise. Then we'll see how these relations carry over to Poisson and more generally distributed noise. These relations give considerable insight into and a quantitative understanding of several estimation theoretic objects, such as the costs of causality and of mismatch, as well as the performance of the minimax estimator under general uncertainty sets. They also enable the transfer of analytic tools and algorithmic know-how from information theory and communications to estimation. A few examples illustrating these points will be presented.

Carl Haber
Lawrence Berkeley National Laboratory.
Sound was first recorded and reproduced by Thomas Edison in 1877. Until about 1950, when magnetic tape use became common, most recordings were made on mechanical media such as wax, foil, shellac, lacquer, and plastic. Some of these older recordings contain material of great historical value or interest but are damaged, decaying, or now considered too delicate to play. Unlike print and latent image scanning, the playback of mechanical sound carriers has been an inherently invasive process. Recently, a series of techniques, based upon non-contact optical metrology and image processing, have been applied to create and analyze high resolution digital surface profiles of these materials. Numerical methods may be used to emulate the stylus motion through such a profile in order to reconstruct the recorded sound. This approach, and current results, including the earliest known sound recordings, are the focus of this talk and will be illustrated with sounds and images.

Inez Fung
Department of Earth & Planetary Science, Department of Environmental Science, Policy and Management, UC Berkeley.
About half the anthropogenic CO2 emitted to the atmosphere is absorbed by the oceans and the land. Knowledge of the locations and magnitudes of the carbon sinks is useful for climate treaty verification. Inversion for the ocean and land sinks from the sparse CO2 observations at remote marine locations has relied on models of atmospheric transport, and are highly uncertain. In the past several years, the availability of global CO2 observations from satellite has greatly expanded the CO2 data volume from O(100) to O(1e6) every two weeks. We present a new integrated carbon data assimilation system that combines raw meteorological observations and all CO2 observations into a global climate model using the Local Ensemble Transform Kalman Filter (LETKF). Preliminary results suggest that it may be feasible to derive CO2 sources and sinks at the surface without priors.

Julien Mairal
Statistics, UC Berkeley.
Sparse linear models have received a lot of attention in statistics, machine learning, signal processing, computer vision, bio-informatics, and neuroscience. Regularization functions encouraging the solution of a problem to be sparse---that is, to have many zero entries, have proven to be useful for different (equally important) reasons. Parcimony can be a good a priori when the ``true'' solution is indeed sparse, leading to better estimation, and sparse models can be easier to interpret than dense ones and computationally cheaper to use. We will start the presentation by reviewing a recent line of work dubbed ``structured sparsity'', where the solutions are not only encouraged to be sparse, but also to follow the (a priori) structure of the problem. Whereas this approach addresses some of the limitations of classical sparse models, it raises challenging new combinatorial problems. In particular, we will focus on supervised learning problems where the features are embedded in~a graph, such as gene expressions in a gene network. We will introduce penalties whose purpose is to automatically select features forming a subgraph with a small number of connected components, and show how the combinatorial problems they involve can be tackled using network flow optimization.

Barbara Romanowicz
Earth and Planetary Science, UC Berkeley.
I will review the different types of data and tomographic methodologies that have been used over the last 30 years to construct three dimensional seismic models of the earth's mantle and describe new opportunities afforded by the accurate numerical seismic wavefield computations recently introduced in global seismology. I will discuss robust features of current global models and their physical interpretation, and issues encountered in the non-linear optimization approaches used in seismic waveform inversion. Finally, I will describe our current efforts to improve earth models by combining trans-dimensional stochastic approaches and numerical wavefield computations, while remaining computationally reasonable.

Marianna Pensky
Department of Mathematics, University of Central Florida.
The study is motivated by analysis of Dynamic Contrast Enhanced Computed Tomography (DCE-CT) data. DCE-CT provides a non-invasive measure of tumor angiogenesis and has great potential for cancer detection and characterization. It offers an in vivo tool for the evaluation and optimization of new therapeutic strategies as well as for longitudinal evaluation of therapeutic impacts of anti-angiogenic treatments. The difficulty of the problem stems from the fact that DCE-CT is usually contaminated by a high-level of noise and does not allows to directly measure the function of interest. Mathematically, the problem reduces to solution of a noisy version of Laplace convolution equation based on discrete measurements, an important problem which also arises in mathematical physics, population dynamics, theory of superfluidity and fluorescence spectroscopy. However, exact solution of the Laplace convolution equation requires evaluation of the inverse Laplace transform which is usually found using Laplace Transforms tables or partial fraction decomposition. None of these methodologies can be used in stochastic setting. In addition, Fourier transform based techniques used for solution of a well explored Fourier deconvolution problem are not applicable here since the function of interest is defined on an infinite interval while observations are available only on a finite part of its domain and it may not be absolutely integrable on its domain.
In spite of its practical importance, the Laplace deconvolution problem was completely overlooked by the statistics community. Only few applied mathematicians took an effort to solve the problem but they either completely ignored measurement errors or treated them as fixed non-random values. For this reason, estimation of a function given noisy observations on its Laplace convolution on a finite interval requires development of a novel statistical theory.
In the talk we present two possible solutions of the Laplace deconvolution problem and discuss their advantages and disadvantages.
This is a joint project with Dr. Abramovich (Tel-Aviv University) Drs. Rozenholc and Comte (University of Paris, Descartes) and Dr. Cuenod (George Pompidou European Hospital).
Gunnar Carlsson
Department of Mathematics, Stanford University.
Most data sets come equipped with a notion of the measure of similarity, which can often be encoded via a suitable distance or metric function. Equipping a set with a distance function can be thought of as equipping the data set with a notion of shape. Topology is the mathematical discipline which concerns itself with "measurement" and "representation" of shape, and over the last 10-15 years there has been a great deal of effort invested in adapting topological methods to study of the shape of data sets. I will survey this work, and provide examples of the kinds of analysis which are possible using it. Dynamic Contrast Enhanced Computed Tomography Data.

Xiao-Li Meng
Department of Statistics, Harvard University.
Not impossible, but more likely you are merely a victim of conventional wisdom. More data or better models by no means guarantee better estimators (e.g., with smaller mean squared error), when you are not following coherent methods such as MLE (for large samples) or Bayesian approaches. Estimating equations are particularly dangerous in this regard, almost a necessary price for their robustness. These points will be demonstrated via common tasks of estimating regression parameters and correlations, under simple models such as bivariate normal and ARCH(1). Some general strategies for detecting and avoiding such pitfalls are suggested, including checking for self-efficiency (Meng, 1994, Statistical Science) and adopting a guiding working model.
Of course, Bayesians are not automatically immune either to being a victim of conventional wisdom. A simple example is given in the context of a stationary AR(1) model where the so-called "non-informative" Jeffreys prior can get arbitrarily close to a point mass at a unit root, hardly non-informative by any measure.
This talk is based on Meng and Xie (2012): "How can I find more information for my estimation?" (for a special issue of Econometric Reviews in memory of Arnold Zellner), which emphasizes that "serious statistical inference is an enterprise involving science, engineering, and even a bit of art. As such, it is virtually always wise to integrate good intuition and conventional wisdom with critical theoretical thinking and rigorous mathematical derivations whenever feasible."

Alexandre Chorin
Department of Mathematics, UC Berkeley.
Implicit sampling finds high-probability samples of a multidimensional probability density through a sequence of steps that includes a minimization and the solution of algebraic equations. I will explain the construction and apply it to problems in data assimilation and in quantum mechanics.

J. Andrés Christen
Centro de Investigación en Matemáticas, Guanajuato, Mexico.
Radiocarbon dating is routinely used in palaeoecology to build chronologies of lake and peat sediments, aiming at inferring a model that would relate the sediment depth with its age. We present a new approach ("Bacon", Blaauw and Christen, 2011) for chronology building that has received enthusiastic attention by palaeoecologists. Our methodology is based on controlling core accumulation rates using a gamma autoregressive semiparametric model with an arbitrary number of subdivisions along the sediment. Using prior knowledge about accumulation rates is crucial and informative priors are routinely used. Since many sediment cores are currently analyzed, using different data sets and prior distributions, a robust (adaptive) MCMC is very useful. We use the t-walk (Christen and Fox, 2010), a self adjusting, robust MCMC sampling algorithm, that works acceptably well in many situations. I'll present some examples and compare results with other approaches.
(*) Coauthor: Maarten Blaauw, Queen's U. Belfast, UK.
Blaauw, M. and Christen, J.A. (2011), "Flexible Paleoclimate Age-Depth Models Using an Autoregressive Gamma Process", Bayesian Analysis, 6(3), 457-474.
Christen, J.A. and Fox, C. (2010), "A General Purpose Sampling Algorithm for Continuous Distributions (the t-walk)", Bayesian Analysis, 5(2), 263-282.
T. Tony Cai
Department of Statistics, The Wharton School, University of Pennsylvania.
Covariance structure is of fundamental importance in many areas of statistical inference and a wide range of applications, including genomics, fMRI analysis, risk management, and web search problems. Estimation of large covariance matrices has drawn considerable recent attention and the theoretical focus so far is mainly on developing a minimax theory over a given parameter space. In this talk, I will discuss some recent results on adaptive estimation of covariance matrices in the high-dimensional setting. The goal is to construct a single procedure that is simultaneously rate optimal over each parameter space in a large collection. We shall begin with adaptive estimation of bandable covariance matrices. A fully data-driven block thresholding estimator is proposed. The estimator is constructed by carefully dividing the sample covariance matrix into blocks and then simultaneously estimating the entries in a block by thresholding. The estimator is shown to be optimally rate adaptive over a wide range of bandable covariance matrices. In addition, adaptive estimation of sparse covariance matrices will also be discussed.
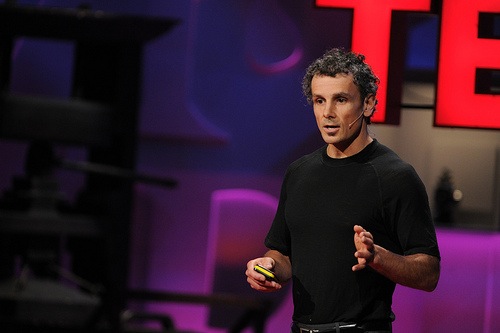
Eric Berlow
UC Merced, Sierra Nevada Research Institute.
Darwin's classic image of an "entangled bank" of interdependencies among species has long suggested that it is difficult to predict how the loss of one species affects the abundance of others in an ecosystem. We show that for dynamical models of realistically structured ecological networks the effect of losing one species on another can be predicted well by simple functions of variables easily observed in nature. On average, prediction accuracy increases with network size, suggesting that greater web complexity simplifies predicting interaction strengths among network nodes.
NOTE: TUESDAY
60 Evans Hall

Wing Wong
Stanford University, Department of Statistics.
Phased genome sequencing and applications
Tuesday, April 24, 4pm-5pm, 60 Evans Hall, UC Berkeley.
We will review recent progress in genome sequencing that can provide phase information. The ability to resolve long range phasing will simplify statistical analysis and will enable new approaches to the study of many issues in biology and medicine. Some of these applications will also be discussed.
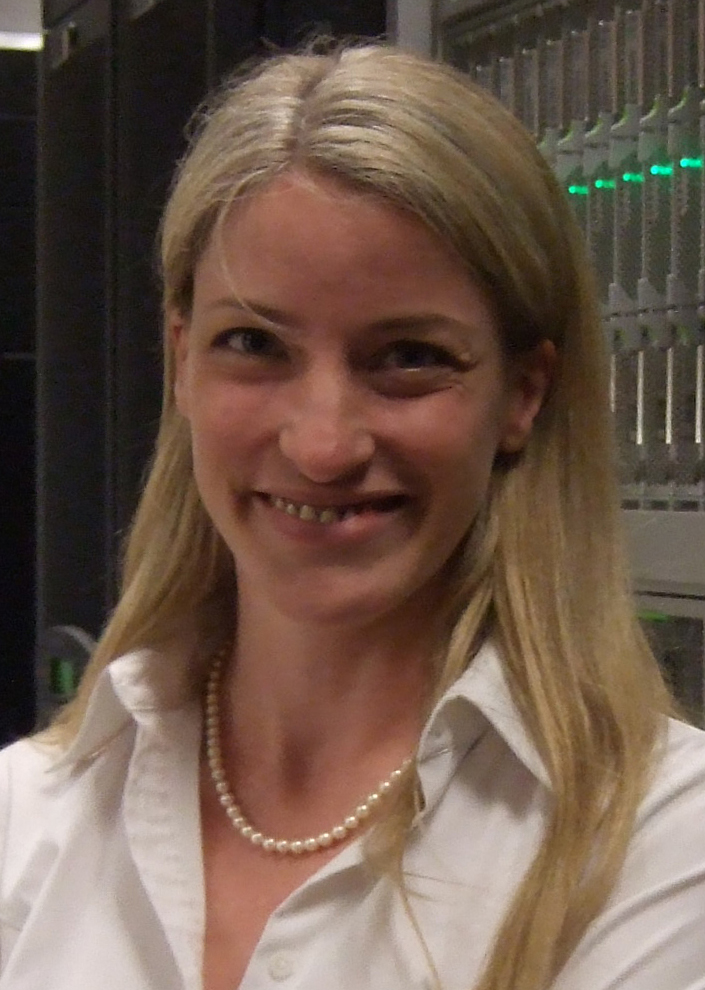
Victoria Stodden
Department of Statistics, Columbia University.
The movement toward reproducible computational science -- where the underlying code and data are made conveniently available along with the published paper -- has accelerated in the last few years. Fields as diverse as statistics, bioinformatics, geosciences, and applied math are making efforts to publish reproducible findings, and journal publication and funding agency requirements are changing. I will motivate the reproducible research movement and discuss my recent work in enabling code and data release through legal and policy standards, as well as new software tools for sharing and deposit.
NOTE: THURSDAY

Rasmus Nielsen
Departments of Integrative Biology and Statistics, UC Berkeley.
Title: Statistical Problems in the Analysis of Next-Generation Sequencing Data
Thursday, May 3, 4pm-5pm, UC Davis.
(Tea and coffee at 3:30pm, 4th floor lounge, Mathematical Sciences Building. Sign up for car pool at front desk by Tuesday.)
The biological sciences have been transformed by the emergence of Next-Generation Sequencing (NGS) technologies providing cheap and reliable large scale DNA sequencing. These data allow us to address biological research questions that previously were considered intractable, but also raise a number of new statistical and computational challenges. The data contain errors that need careful attention, and the appropriate likelihood functions are usually not computationally accessible, because of the size of the data sets. I will discuss some solutions to these problems and illustrate them in the analyses of several different data sets In one study we sequenced all protein coding genes of 2000 individuals to identify mutations associated with Type 2 Diabetes. In a second project we used similar sequencing techniques to identify the genetic causes of altitude adaptation in Tibetans. In the third study I will discuss, we sequenced the first Aboriginal Australian genome to elucidate the history and origins of Aboriginal Australians.
 Neyman Seminar. Spring
2012.